
A candlestick chart is merely a summary of past transactions. Order flow is the real-time record of the actual transactions taking place inside the order book — the causal layer beneath every price movement.
Every tick printed on your screen is the concrete outcome of aggressive market orders crossing the spread to fill against resting passive limit orders. Reading order flow does not rely on lagging mathematical formulas or geometric chart patterns. Instead, it observes market participants in real time: asking at each price who was in control, how much size traded, and whether the aggression achieved meaningful progress or exhausted itself.
This pillar guide presents the complete educational curriculum for Order Flow trading, structured around first principles, market microstructure, and institutional execution mechanics.
---
1. What Is Order Flow Trading?#
Traditional retail technical analysis analyzes the *effect* — candlesticks, moving averages, and oscillators — and attempts to infer the cause. Order flow trading inverts this relationship: it directly monitors the *cause* — the execution of aggressive market orders against passive limit orders — to anticipate the most probable effect.
In modern electronic futures markets (such as the E-mini S&P 500 [ES], Nasdaq-100 [NQ], and Gold [GC]), price changes occur solely because one side of the market is willing to pay the spread and exhaust available liquidity at a given price level. Order flow trading is the discipline of decoding this mechanical auction.
2. How Order Flow Works The Market as a PvP Arena#
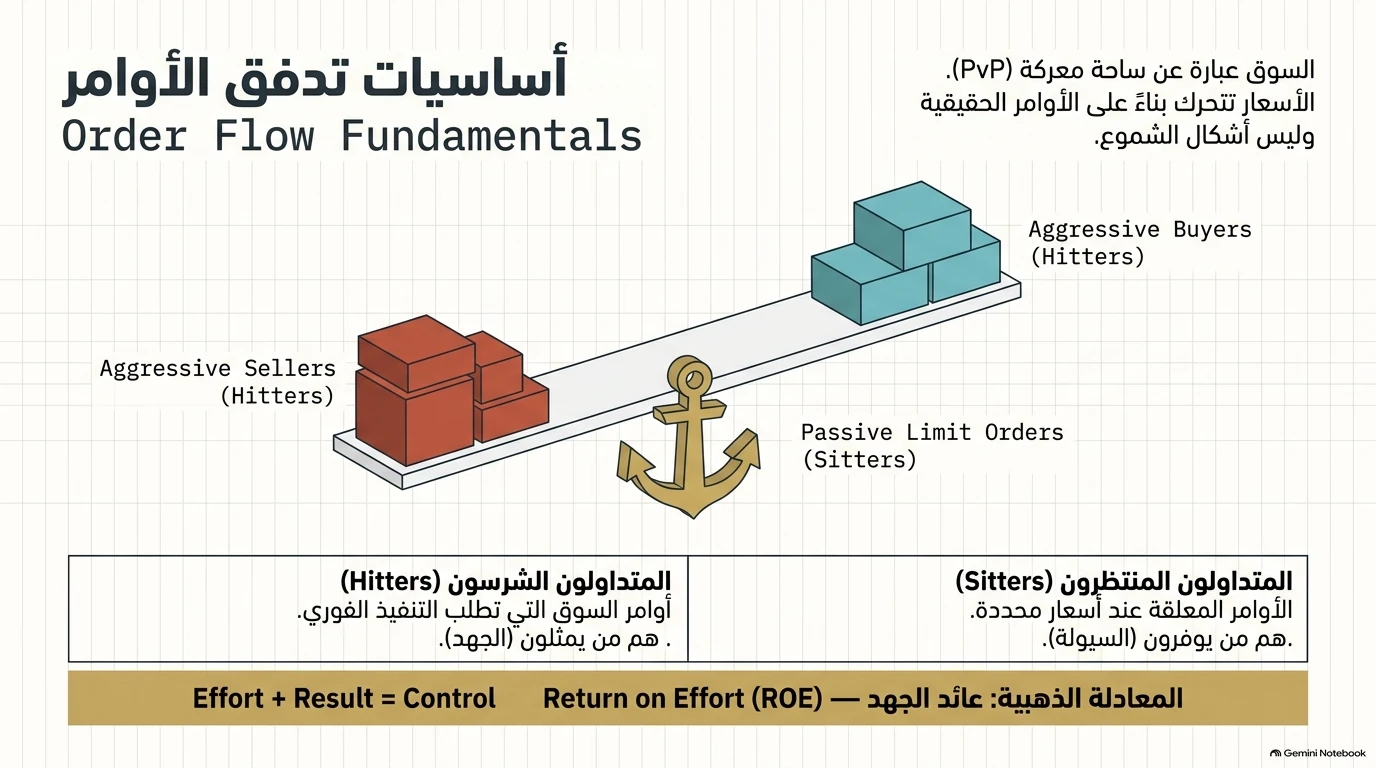
Financial markets are fundamentally a peer-to-peer battleground (PvP). Prices do not move because of abstract shapes; they move based on the immediate balance of real buy and sell orders.
Market participants are divided into two distinct groups: 1. Aggressive Traders (Hitters): Participants executing Market Orders demanding immediate fills. They represent the active effort driving the auction forward. 2. Passive Traders (Sitters): Participants placing Limit Orders resting in the Order Book (DOM). They provide the liquidity that acts as the barrier the hitters must overcome.
The Golden Formula: Return on Effort (ROE)
Effort + Result = Control
When aggressive traders expend heavy volume and price advances in their direction, they have achieved a return on effort. When heavy volume is expended with zero price progress, an institutional trap is formed.For a comprehensive breakdown of the PvP arena and market participants, read our dedicated guide: Order Flow Fundamentals: Hitters, Sitters, and Return on Effort.
3. Auction Market Theory Balance vs. Imbalance#
Markets exist for one primary economic purpose: to facilitate trade between buyers and sellers. Under Auction Market Theory (AMT), the market constantly oscillates between two structural phases:
- Phase 1: Balance (Fair Value Agreement): Price trades in a sideways bracket where buyers and sellers agree on value. High two-way trade facilitation occurs with balanced volume.
- Phase 2: Imbalance (Price Discovery): One side dominates, causing an explosive directional move as the auction explores higher or lower prices in search of a new balance.
The golden rule of auction theory states that breakout and acceptance outside a prior balance area provides the highest-probability trading opportunities.
Explore the complete auction mechanics in our detailed guide: Auction Market Theory: Balance, Imbalance, and Value Migration.
4. Passive vs. Aggressive Orders#
To understand order flow, one must recognize how orders interact: * Market Buy Orders lift the Ask (Offer). * Market Sell Orders hit the Bid. * Limit Buy Orders rest on the Bid, waiting to be filled by market sellers. * Limit Sell Orders rest on the Ask, waiting to be filled by market buyers.
Passive orders cannot move the market; they can only absorb aggressive flow. Price can only tick higher if aggressive market buyers completely fill every single resting sell contract available at the current Ask.
5. Bid and Ask Mechanics#
At any given moment, the Order Book displays the best available Bid and Ask. The spread is the difference between them. When you observe an order flow ladder or Footprint chart, transactions are recorded diagonally across this spread: * Aggressive buyers interact with passive sellers at the Ask. * Aggressive sellers interact with passive buyers at the Bid.
Understanding this diagonal relationship is essential for calculating Delta and identifying Stacked Imbalances.
6. Return on Effort ROE#
One of the most foundational principles in institutional order flow is Return on Effort (ROE): * High Effort + High Result = Dominance. Heavy market buying drives prices up through multiple ticks. The aggressive buyers have achieved positive ROE and remain firmly in control. * High Effort + Zero Result = Absorption. Massive aggressive buying hits the Ask, but price fails to tick higher because a massive institutional passive limit order absorbs every contract. The aggressive buyers receive zero ROE and are now trapped.
7. Acceptance vs. Rejection#
When price breaks out of an established range, the market presents two potential outcomes: 1. Acceptance: Price holds outside the range, prints high volume, and begins constructing a new Value Area. This confirms a trend continuation. 2. Rejection (Failed Auction): Price probes outside the range on low volume (exhaustion) or is aggressively pushed back inside by passive absorption. The auction outside value failed, and price rapidly rotates across the entire balance area to test the opposite extreme.
8. Footprint Charts#
A Footprint Chart (or Cluster Chart) provides an X-ray view inside every candlestick. Instead of showing only the Open, High, Low, and Close, it breaks down the exact contracts traded on the Bid versus the Ask at every price tick.
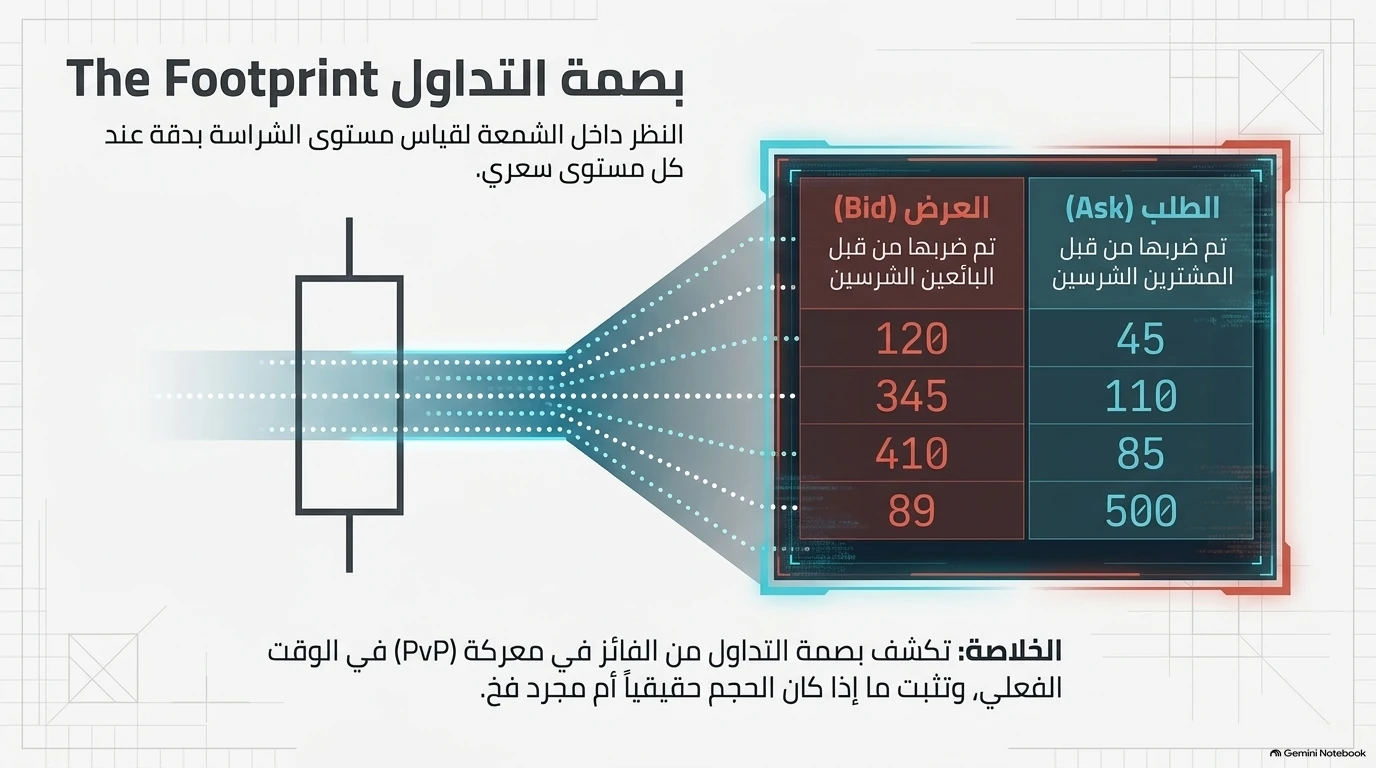
With a Footprint chart, you can instantly observe: * Bid/Ask Volume Distribution: Exactly who was hitting the market at each price level. * Point of Control (POC): The specific price within the bar where the greatest volume transacted. * Imbalances: Price levels where aggressive buying or selling was multiple times larger than the opposing side. * Unfinished Business (Poor Highs / Lows): Zero prints at extreme bars indicating whether an auction completed naturally.
Study the full visual guide: What Is a Footprint Chart? How to Read Inside the Candle.
9. Delta and Cumulative Volume Delta CVD#
Delta is the net difference between aggressive buying and aggressive selling for any given bar or price level:
Delta = (Market Buys) - (Market Sells)
- Positive Delta: Aggressive buyers were more active.
- Negative Delta: Aggressive sellers were more active.
- Cumulative Volume Delta (CVD): A running sum of Delta over the trading session, plotted as a continuous line alongside price.
When CVD rises sharply to new highs while price fails to make a higher high, it creates an Effort Without Return Divergence — an unmistakable warning that aggressive buyers are walking into an institutional wall.
Master Delta analysis in our dedicated guide: Delta & Cumulative Volume Delta (CVD): Detecting Institutional Footprints.
10. Aggression#
Aggression represents urgent market participants demanding immediate liquidity. Aggressive traders are willing to cross the spread and absorb the bid-ask transaction cost because they expect price to move substantially in their direction. Spotting sustained aggression is key to identifying trending market conditions.
11. Order Flow Imbalance#
An Order Flow Imbalance occurs when the volume at a specific price on the Ask exceeds the volume on the Bid diagonally below it by a predetermined ratio (typically 300% to 400% / 3:1 to 4:1).
When multiple imbalances stack consecutively across consecutive price levels (a Stacked Imbalance), it signifies overwhelming institutional aggression that defends that price zone upon any subsequent retest.
Read the detailed breakdown: Aggression & Order Flow Imbalance: Identifying Structural Breakouts.
12. Order Flow Absorption#
Absorption is the premier reversal setup in order flow trading. It represents high effort with zero price result: * Institutional participants place large passive limit orders at key structural levels (such as Value Area High, Daily Highs, or Liquidity Pools). * Retails and momentum traders dump thousands of market orders into the level. * The passive orders swallow every incoming market order without allowing price to advance. * Once the aggressive participants exhaust their capital, the market snaps aggressively in the opposite direction.
Read the complete study on trapping institutional flow: Order Flow Absorption: Spotting Institutional Traps at Structural Levels and explore our long-form analysis in Order Flow Volume Absorption.
13. Order Flow Exhaustion#
Unlike absorption — where aggressive orders crash into a passive limit wall — Exhaustion occurs when the market simply runs out of fuel.
As price reaches an extreme level, participants refuse to bid or offer further. Volume dwindles to near zero, Delta flattens, and price rolls over smoothly due to a total lack of aggressive interest.
Distinguish between absorption and exhaustion in: Order Flow Exhaustion: Why Trends Die from Volume Depletion.
14. Liquidity and Heatmaps#
Price is attracted to liquidity like a magnet. Large resting limit orders visible on Liquidity Heatmaps (such as Bookmap or Depth of Market [DOM] visualizations) represent the fuel that price seeks out to facilitate trade.
- Smart Money accumulates inside dense liquidity blocks.
- Breakouts accelerate rapidly through thin liquidity voids.
- Reversals trigger upon colliding with persistent, deep liquidity walls.
Explore the depth of book guide: Liquidity & Heatmaps: Reading the Hidden Order Book.
15. Volume Profile#
While standard volume histograms show volume per unit of *time*, Volume Profile displays volume distributed across *price levels*. This reveals the exact prices where institutional market participants spent the most capital.
Common profile distributions include: * P-Shape (Bullish / Short Covering): Heavy volume concentrated in the upper half of the range. * b-Shape (Bearish / Long Liquidation): Heavy volume concentrated in the lower half of the range. * Thin Shape (Trending Day): Elongated distribution with small volume clusters separated by low volume nodes.
Study the full volume structure: Volume Profile: Identifying Institutional Value Zones and read our comprehensive Volume Profile Complete Guide.
16. HVN, LVN, POC, VAH, and VAL#
Every Volume Profile provides critical market structure coordinates: * Point of Control (POC): The single price level where the highest volume was traded during the session. * Value Area (VA): The price range containing 70% of total traded volume. * Value Area High (VAH) & Value Area Low (VAL): The upper and lower boundaries of the fair value zone. * High Volume Node (HVN): Areas of high market acceptance where price tends to slow down and consolidate. * Low Volume Node (LVN): Areas of price rejection where the auction moved swiftly, acting as formidable support or resistance on retests.
You can chart these levels with tick-level precision using the free DeltaVolumeProfileX tool for NinjaTrader 8.
17. Volume-Weighted Average Price VWAP#
VWAP is the true institutional benchmark for intraday fair value. Large institutional algorithms are evaluated based on their ability to execute below VWAP when buying or above VWAP when selling. When combined with Volume Profile Value Areas, VWAP standard deviations provide dynamic support and resistance targets.
18. Market Environment and Gamma Exposure GEX#
The broader options market structure heavily influences how order flow behaves intraday. Gamma Exposure (GEX) measures how options dealers must hedge their underlying stock or index futures positions: * Positive GEX (+GEX): Options market makers are long gamma. To remain delta-neutral, they buy when price falls and sell when price rises. This dampens market volatility, creating a Mean Reversion environment where breakouts fail and absorption setups thrive. * Negative GEX (-GEX): Options market makers are short gamma. They must sell into declining prices and buy into rising prices. This amplifies volatility, creating an explosive Trending / Imbalance environment where breakouts accelerate violently.
Understand how dealer positioning governs order flow: Market Environment & GEX: Positive vs. Negative Gamma Regimes.
19. The CZT Setup Framework#
To eliminate emotional subjectivity from trade selection, we employ the CZT Setup Framework. A high-probability trade requires three aligned pillars:
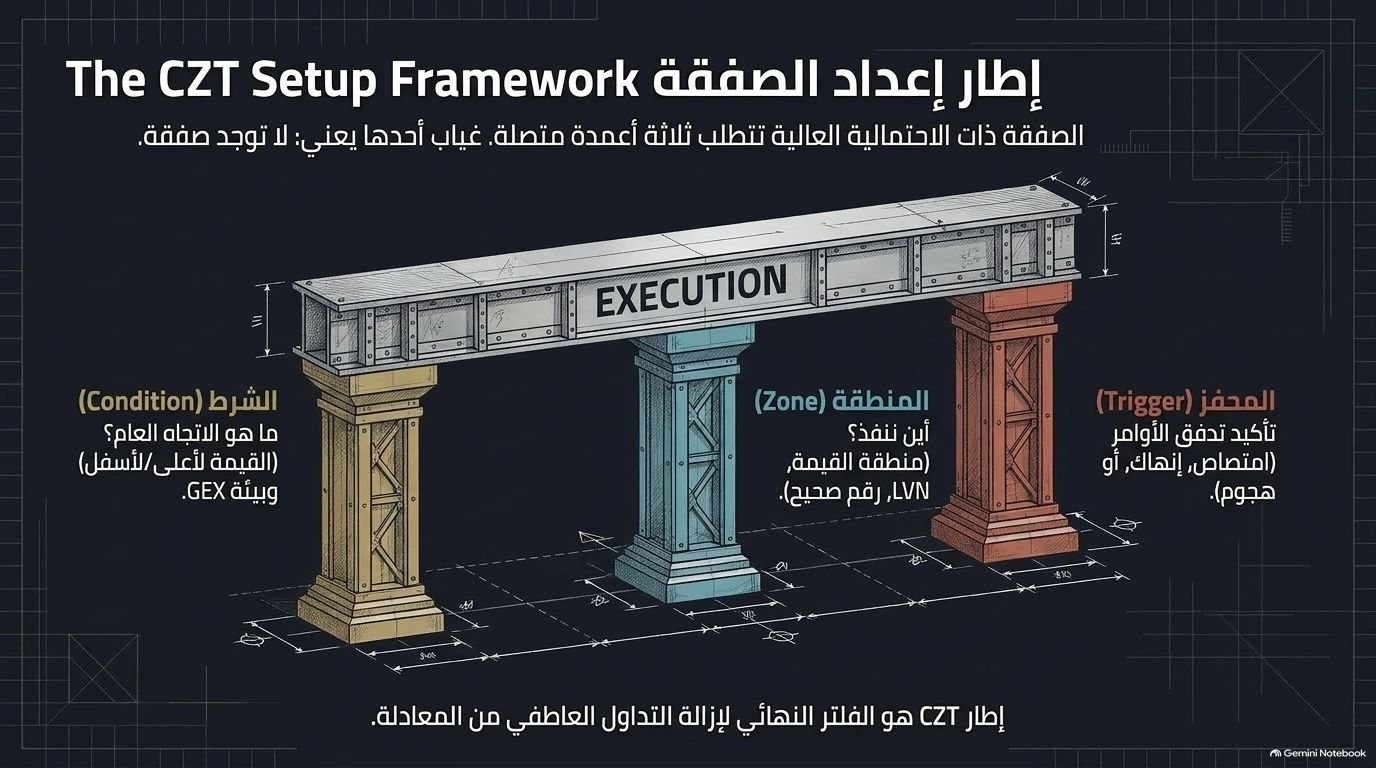
- Condition (The "Why"): What is the macro regime? Is value migrating higher or lower? Are we in a Positive GEX (range-bound) or Negative GEX (trending) environment?
- Zone (The "Where"): Where are we executing? At a Value Area boundary (VAH/VAL), an Untested LVN, or a key structural swing high/low?
- Trigger (The "When"): What is the order flow micro-confirmation? Are we seeing Absorption, Exhaustion, or a Stacked Imbalance on the Footprint chart?
The Rule of Three: If any of the three pillars is absent, there is no trade.
Study the operational blueprint: The CZT Setup Framework: Condition, Zone, and Trigger.
20. Entry Confirmation The Trap and The Shift#
Never anticipate a reversal before it proves itself. Professional entry confirmation consists of two distinct stages: * Stage 1: The Trap: Aggressive participants drive price into a key zone (e.g. support) and fail to achieve ROE. A Footprint cluster reveals heavy selling delta with zero downward continuation. * Stage 2: The Shift: The opposing side steps in with aggressive market orders, creating an aggressive imbalance and establishing positive ROE. Enter only once this shift confirms that the trapped participants must cover their positions.
Read the complete execution guide: Order Flow Entry Confirmation: Mastering the Trap and the Shift.
21. Trade Management Trailing Behind Structure#
Managing an open position must be as objective as entering it. Rather than utilizing arbitrary tick targets or static stop-losses: * Recognize the staircase progression: Balance → Imbalance → New Balance. * As price enters a state of imbalance, aggressive participants control the move. * Trail your protective stop strictly behind the latest structural point where the auction transitioned from balance into imbalance.
Learn how to preserve capital and maximize trend extraction: Order Flow Trade Management: Trailing Stops Behind Structural Imbalances. To practice disciplined risk management and track execution metrics, use MA TradeLab.
22. Failure Patterns#
Cutting losses swiftly when an order flow thesis is invalidated is the hallmark of professional survival. Three critical failure patterns must trigger immediate trade closure: 1. Failed Auction: Price attempts to break outside a Value Area, is immediately absorbed, and snaps back inside the prior balance. 2. Order Flow Divergence: Price reaches a new swing high or low, but CVD drastically diverges, revealing an absence of aggressive participation. 3. Invalidated Balance: Price slices aggressively back inside the structural zone that was meant to act as your protective shield.
Study how to exit trades with discipline: Order Flow Failure Patterns: Immediate Invalidation Signals.
23. Complete Order Flow Trading Framework#
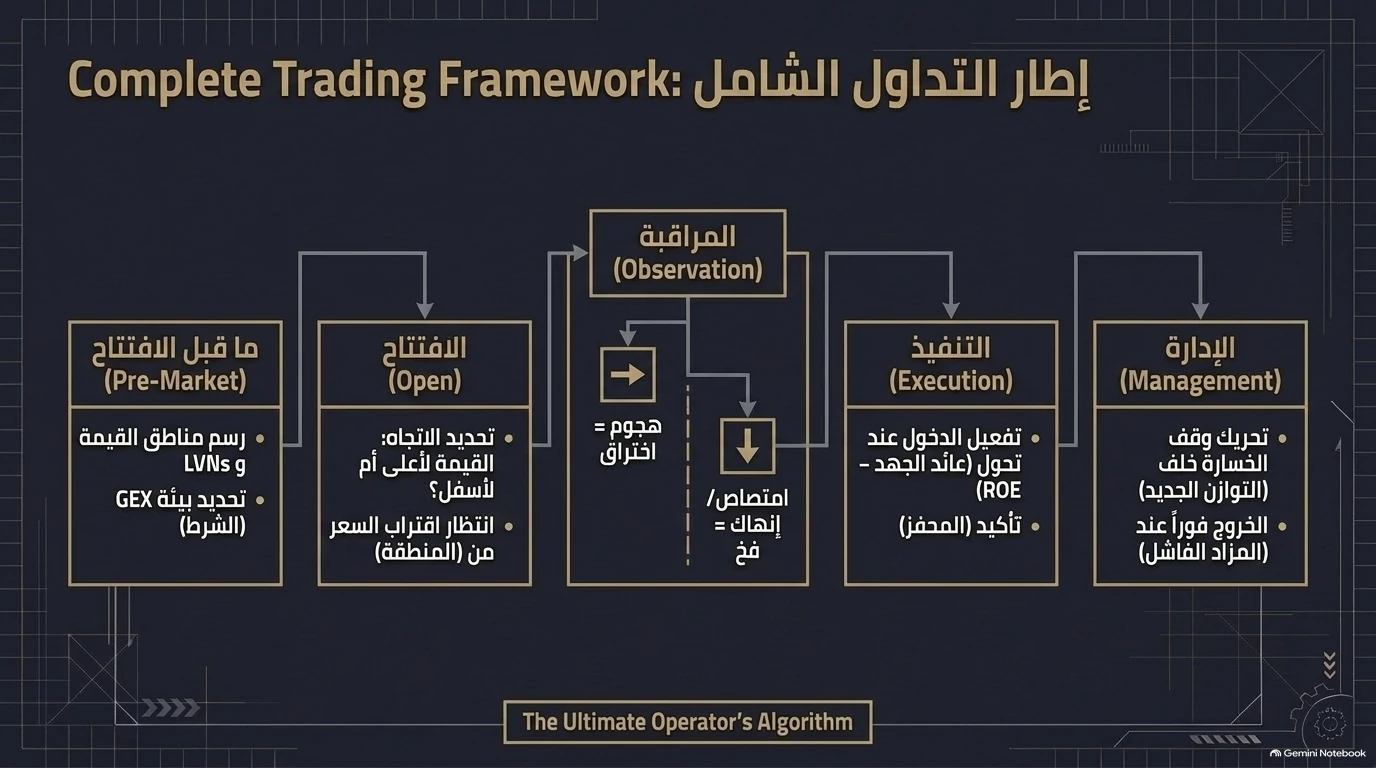
Combining these 22 components creates The Ultimate Operator's Algorithm: 1. Pre-Market: Map structural Value Areas, LVNs, and identify the prevailing GEX environment. 2. Open: Determine whether the open auction accepts or rejects the prior day's value; wait patiently as price approaches your pre-defined zones. 3. Observation: Monitor the Footprint and CVD for absorption or aggression as price reaches the zone. 4. Execution: Pull the trigger when the CZT criteria are fully satisfied and the shift in ROE confirms trapped participants. 5. Management: Trail your stop behind newly established balance zones and exit immediately upon observing any failure pattern.
This systematic process replaces guesswork with verifiable market mechanics.
24. Original Course Source#
This pillar guide and the associated Order Flow knowledge cluster are based on the educational course:
"The Only Order Flow Guide You'll Ever Need" *Instructor:* Jesse Rogers / Casper Trading
Watch the complete original course on YouTube: https://youtu.be/5wQAiO8QyRc
*Note: This platform does not own or claim production of the original video material. It is curated and systematized here strictly as an open educational reference for independent traders.*