
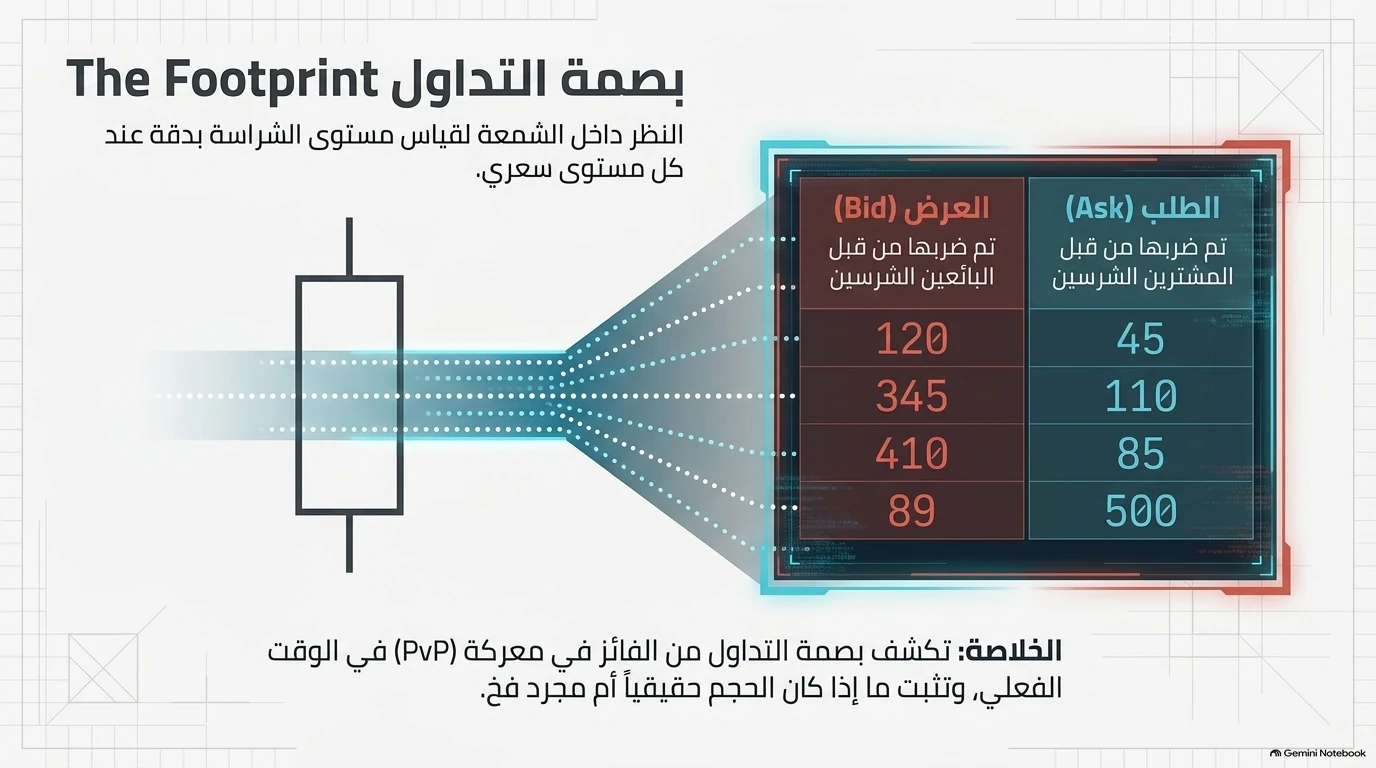
A standard candlestick chart conceals the most important information: what actually happened inside the bar. A Footprint Chart (also known as a Cluster Chart) provides an X-ray view of the candlestick, displaying the exact volume executed on the Bid and Ask at every individual price level.
1. What a Footprint Chart Reveals#
Instead of a hollow candlestick, the Footprint displays a two-column ladder at every price tick: * Left Column — The Bid (العرض): Traded volume initiated by aggressive market sellers hitting resting limit bids. * Right Column — The Ask (الطلب): Traded volume initiated by aggressive market buyers lifting resting limit offers.
Key Takeaway: The Footprint reveals who is winning the peer-to-peer battle (PvP) in real time, proving whether volume represents genuine directional commitment or an institutional trap.
2. How to Read Transactions Diagonally#
Because market orders match against resting limit orders across the spread, orders on a Footprint chart are compared diagonally: * A market buy at price $100.25 on the Ask matches against a limit order at that price. * It is compared against the market sell at price $100.00 on the Bid diagonally below it.
This diagonal comparison is what allows algorithms and traders to calculate Order Flow Imbalances (e.g. 500 contracts traded on the Ask vs. 89 contracts on the Bid = a 5.6:1 buying imbalance).
3. Core Elements of a Footprint Candle#
- Bar Point of Control (POC): The specific price level inside the candle with the highest traded volume. A POC near the top of a bullish candle confirms aggressive acceptance; a POC near the extreme high of a candle with a long upper wick signals potential absorption.
- Candle Delta: The net difference between aggressive market buying and aggressive market selling across all prices within that bar (
Delta = Ask Volume - Bid Volume). - Stacked Imbalances: Multiple consecutive price levels showing aggressive buy or sell dominance, confirming institutional initiative.
- Finished vs. Unfinished Auctions (Zero Prints): A finished auction shows 0 contracts traded on the extreme Bid of a high or Ask of a low, signaling that no market orders were willing to push further.
4. Practical Interpretation#
- Spotting Trapped Buyers: If you see a massive volume cluster on the Ask at the extreme high of a candle, followed by an immediate red reversal bar closing below that cluster, aggressive buyers are trapped.
- Confirming Breakouts: A genuine breakout through resistance prints stacked green imbalances on the Ask, with volume increasing as price accelerates.
Continue to Delta & CVD Analysis or study how to spot Order Flow Absorption.
Return to the Order Flow Pillar Guide.