
While total volume tells you *how much* activity occurred, Delta reveals *who was responsible* for that activity. It is the purest quantitative measure of net market aggression.
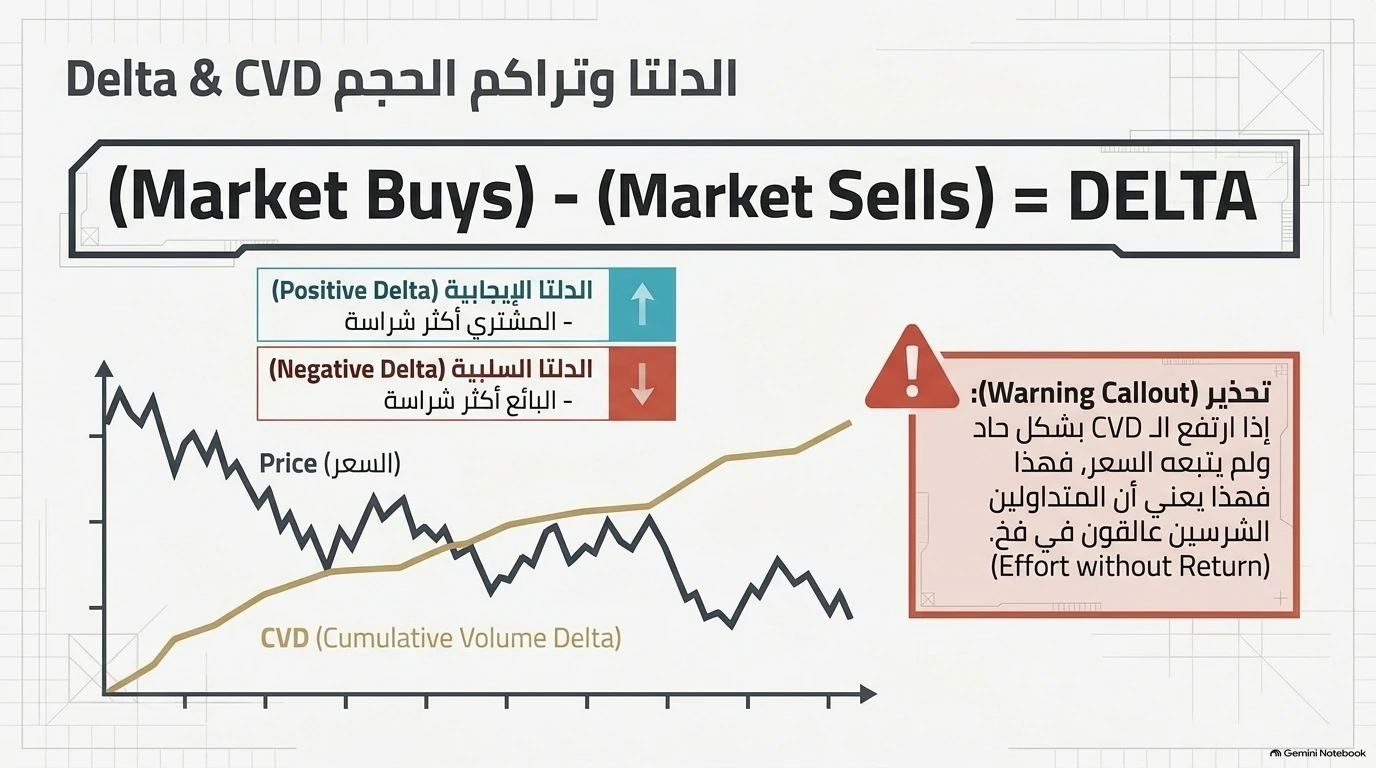
1. The Delta Formula#
Delta calculates the absolute net difference between aggressive market orders:
(Market Buys) - (Market Sells) = DELTA
- Positive Delta (+Delta): Market buys exceeded market sells. Aggressive buyers were more active and willing to cross the spread.
- Negative Delta (-Delta): Market sells exceeded market buys. Aggressive sellers were more active and aggressive.
2. Cumulative Volume Delta CVD#
Cumulative Volume Delta (CVD) is a running total of Delta throughout the trading session: * At the session open, CVD begins at 0. * For each bar, the bar's delta is added to (or subtracted from) the running cumulative line. * Plotted directly alongside price, CVD visually illustrates whether market buying or selling is driving the day's trend.
In a healthy uptrend, price creates higher highs accompanied by CVD creating higher highs, confirming that aggressive buyers are continually funding the move.
3. The Warning Callout: Effort Without Return#
The most powerful trade signal generated by CVD is the Effort Without Return Divergence:
Warning Callout:
If CVD rises sharply to new highs while price fails to follow and prints a lower high, aggressive traders are trapped in an institutional wall.
Effort without Return = AbsorptionWhen CVD explodes upward, it proves that retail and momentum traders are buying aggressively. If price does not rise alongside this massive volume, those aggressive market buys are being swallowed by passive institutional limit sell orders. A severe downward reversal is imminent.
4. Key Divergence Patterns to Trade#
- Absorption at Resistance (Bearish): Price tests session highs; CVD surges to a new extreme; price closes with a rejection wick. Short setup targeting the session POC.
- Absorption at Support (Bullish): Price tests support; CVD drops sharply to session lows; price holds and prints a higher low. Long setup targeting the Value Area High.
- Exhaustion Roll-Over: Price pushes to a marginal new high, but CVD remains flat or slopes downward with declining bar delta. The auction lacks aggressive buyers to sustain the push.
Study how CVD divergences trigger Order Flow Absorption and recognize Order Flow Failure Patterns.
Return to the Order Flow Pillar Guide.