
Traditional volume indicators display volume as vertical bars at the bottom of the chart, showing volume relative to *time*. Volume Profile plots volume horizontally along the price axis, revealing *at what price* market participants committed capital.
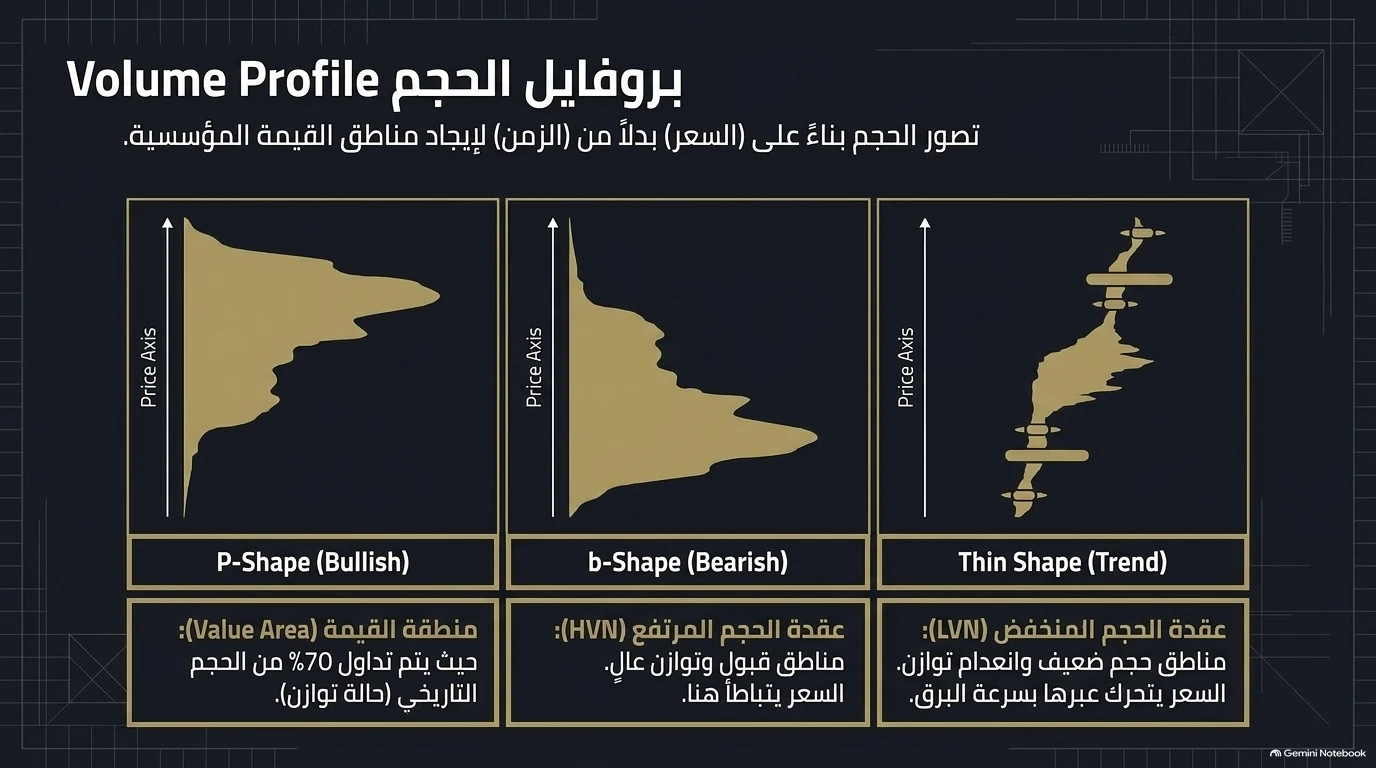
1. The 3 Primary Profile Shapes#
The shape of a Volume Profile reveals the underlying auction state:
1. P-Shape Profile Bullish / Short Covering Visual Structure: A thin, elongated lower tail with a wide volume cluster concentrated in the upper portion of the range. Market Dynamics: Aggressive buyers drove price higher early in the session; higher prices were accepted, and trade consolidation occurred near the highs. Often caused by short covering or aggressive institutional accumulation.#
2. b-Shape Profile Bearish / Long Liquidation Visual Structure: A thin upper tail with a wide volume cluster concentrated in the lower portion of the range. Market Dynamics: Aggressive sellers drove price down; lower prices were accepted, forming balance near the session lows. Often caused by long liquidation.#
3. Thin Shape Profile Trending Day Visual Structure: An elongated, narrow profile with small volume nodes spread across a wide price range. Market Dynamics: Continuous imbalance throughout the session. The market never paused long enough to build value; directional trend day.#
2. Core Structural Coordinates#
Every Volume Profile provides critical market coordinates: * Value Area (VA): The price zone where 70% of total volume transacted during the session. Represents consensus fair value. * Point of Control (POC): The single price level that transacted the highest volume. Acts as a powerful magnet. * High Volume Node (HVN): Areas of high acceptance and trade facilitation. Price slows down and rotates here. * Low Volume Node (LVN): Areas of rapid rejection and imbalance. Price slices through LVNs swiftly. On pullbacks, LVNs act as strong structural support or resistance.
3. Practical Trading Framework#
- Inside the Value Area: Expect choppy, two-way mean-reversion trading between VAH and VAL.
- Outside the Value Area: Look for acceptance outside value to ride momentum, or rejection back inside to target the opposite boundary.
For tick-precise Volume Profile charting on NinjaTrader 8, download our free tool: DeltaVolumeProfileX Indicator. Read our complete guide: Volume Profile Mastery Guide.
Return to the Order Flow Pillar Guide.