
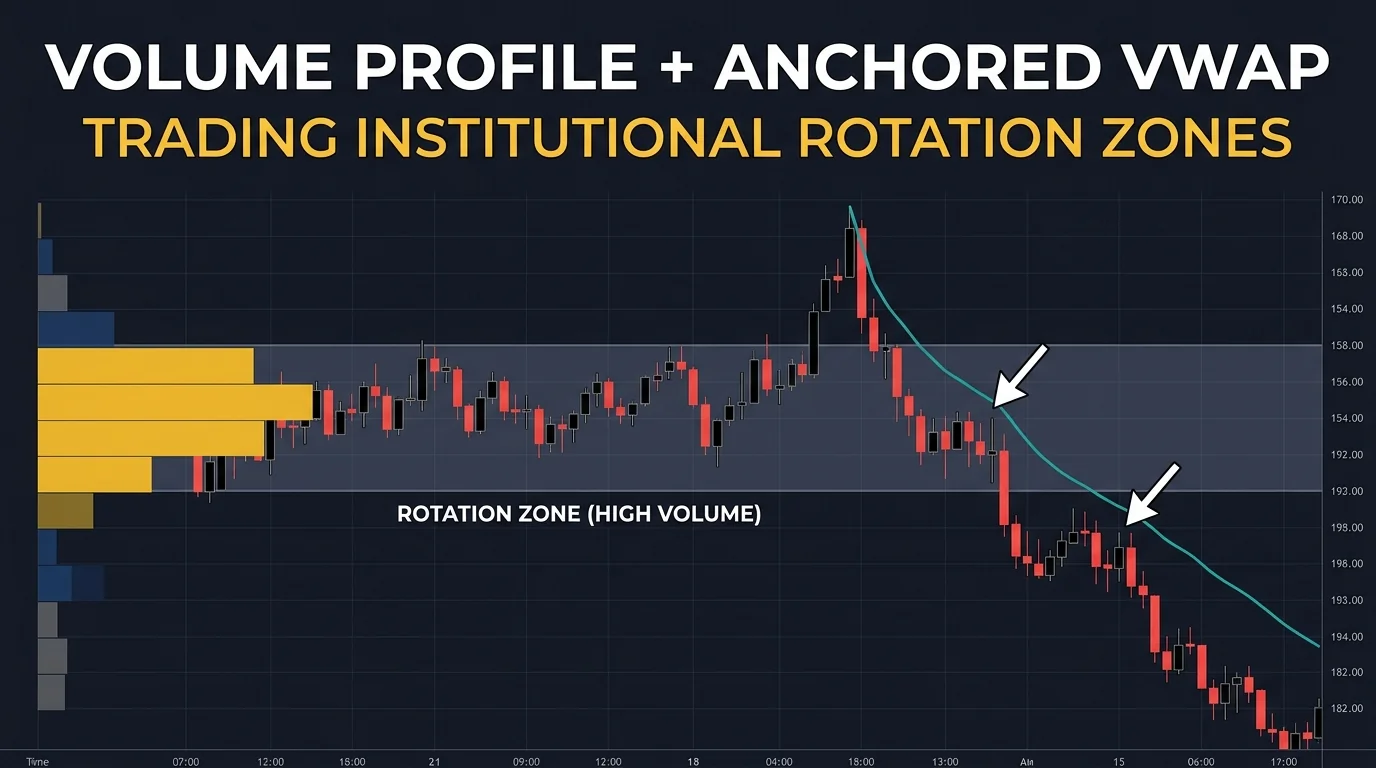
Understanding where market participants agree and disagree on price is the cornerstone of professional market analysis. Unlike traditional volume indicators that plot traded contracts over time at the bottom of the chart, Volume Profile calculates and displays traded volume horizontally across specific price levels (Volume by Price).
This structural view allows traders in active futures contracts — such as Nasdaq 100 (NQ), S&P 500 (ES), and Gold (GC) — to identify true institutional value and execute with asymmetrical risk-reward setups.
1. What is Volume Profile Volume by Price?#
Traditional candlestick charts combined with standard volume indicators display *when* volume happened. Volume Profile reveals *at what price* volume was transacted. This distinction is critical because institutions do not simply buy or sell at a particular minute; they build positions across specific price distributions.
When price spends significant time and volume at a level, that price represents market acceptance and fair value. Conversely, when price moves rapidly through a price range on light volume, it signals market rejection.
2. Core Components of Volume Profile#
To read a Volume Profile correctly, you must master its key structural elements:
- Point of Control (POC): The single price level with the highest traded volume during the specified period. It represents the fair value price where buyers and sellers reached peak agreement.
- Value Area (VA): The price range containing 70% of total traded volume during the session (statistically derived from the first standard deviation of the volume distribution).
- Value Area High (VAH): The upper boundary of the fair value zone. Above VAH, price is perceived as expensive by buyers unless new aggressive buying develops.
- Value Area Low (VAL): The lower boundary of the fair value zone. Below VAL, price is perceived as cheap by sellers unless aggressive selling pushes for lower prices.
- High Volume Nodes (HVN): Price clusters with elevated volume that act as market gravity, slowing down momentum and providing solid reference areas.
- Low Volume Nodes (LVN): Price zones with thin volume where the auction moved swiftly. LVNs act as rejection barriers and clear structural stop-loss anchors.
3. Profile Shapes and Market Psychology#
The distribution shape of a Volume Profile provides immediate insight into the current auction dynamic:
- D-Shape Profile: Symmetrical bell curve indicating a balanced, two-sided market revolving around a central POC.
- P-Shape Profile: Heavy volume concentrated at the top with a thin tail at the bottom. Typical of short covering or aggressive buying that accepted higher prices.
- b-Shape Profile: Heavy volume concentrated at the bottom with a thin tail at the top. Signals long liquidation or heavy passive buying absorbing downward pressure.
- I-Shape (Thin Profile): Elongated distribution created during aggressive trend days with multiple Low Volume Nodes and rapid price discovery.
4. Developing POC vs. Naked Virgin POC#
- Developing POC: The dynamic Point of Control shifting in real-time as new volume enters the market throughout the trading day.
- Naked POC (VPOC): A Point of Control from a prior session that has not yet been touched or re-tested by subsequent price action. Unchecked volume nodes act as powerful magnets for future sessions.
5. Practical Executable Strategy#
When trading index futures like NQ or ES:
- Context: If price opens outside the prior day's Value Area and fails to build acceptance beyond the range, look for a rejection.
- Trigger: A rotation back inside the Value Area (breaking VAL or VAH with negative/positive delta confirmation) offers a high-probability mean-reversion opportunity.
- Targets: Target 1 is the session POC, and Target 2 is the opposite side of the Value Area (VAH / VAL).
- Risk Management: Place your protective stop-loss strictly behind the nearest Low Volume Node (LVN) or the session extreme.
To see how this framework connects with real-time institutional flow, read our guide on Order Flow Mechanics, examine Order Flow Absorption, or study our Mean Reversion Trading Strategy. You can also plot tick-accurate profiles on NinjaTrader 8 with our free indicator DeltaVolumeProfileX.
Comments (0)
Comments are moderated. Your comment will appear after it's approved.
Comments are moderated. Your comment will appear after it's approved.
Loading comments…