
Interpretive research — not financial advice
Mean Reverting
A setup that works only while price is still inside the session's first 30-minute range — a sell fade at the top of the value area, or a buy fade at its bottom, with smaller size and a strict daily loss limit.
The day's gate: the first 30-minute range (IVB)
IVB (Initial Volume Balance) = the first 30-minute range of the official trading session. This range is the market's first "vote" on the day's fair value, and it is what determines which setups are allowed to run now.
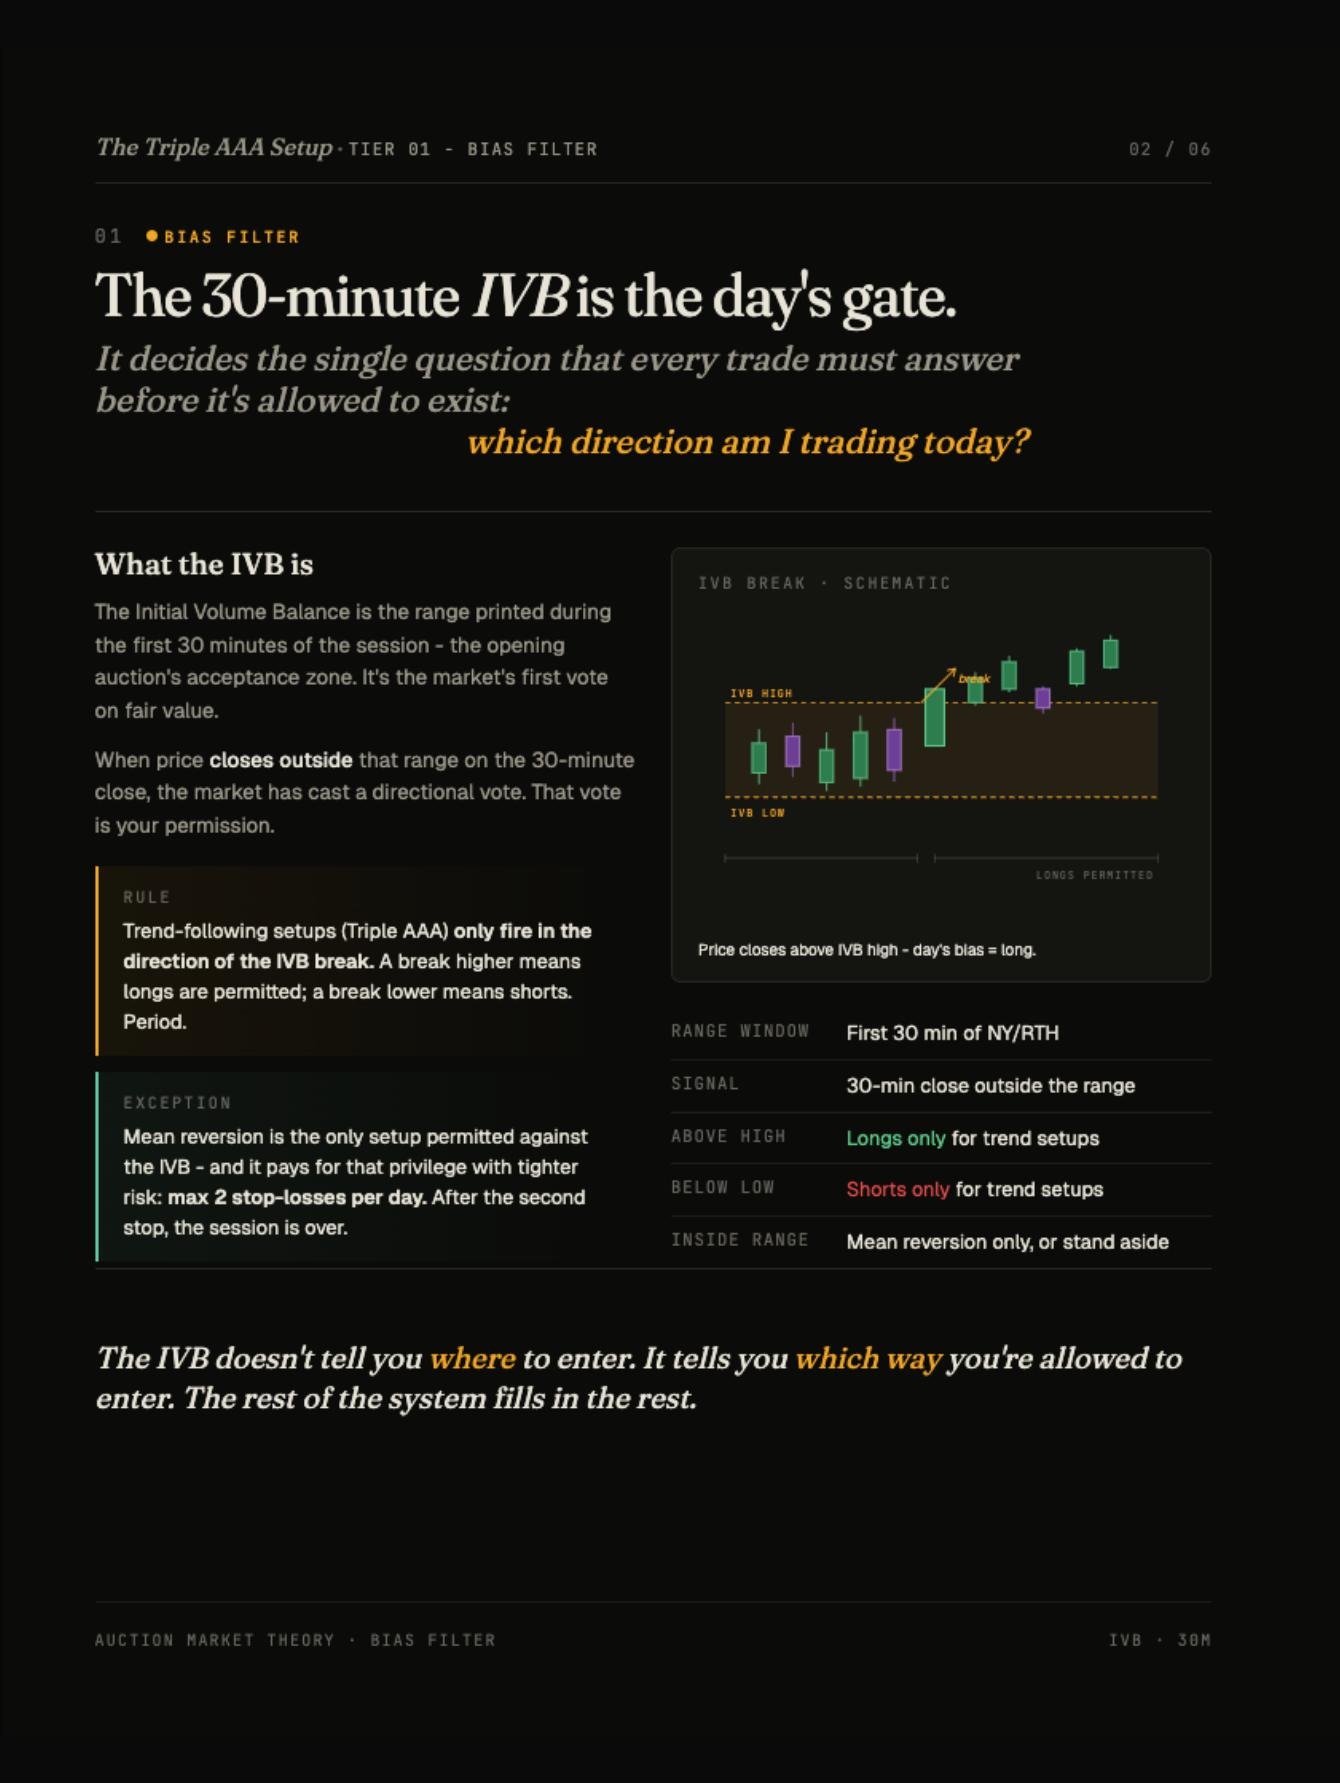
| State | Permitted decision |
|---|---|
| Close above the range's upper bound | The trend-following path opens (separate page) — no mean-reversion against this direction except in a limited exception |
| Close below the range's lower bound | The same, inverted |
| Price still inside the range | This setup only: mean reversion |
The setup: fade at the edge of the value area
As long as price is inside the range, the opportunity is at the edges of the daily value area (VAH at the top bound, VAL at the bottom) — where the bound is tested and rejected rather than broken.
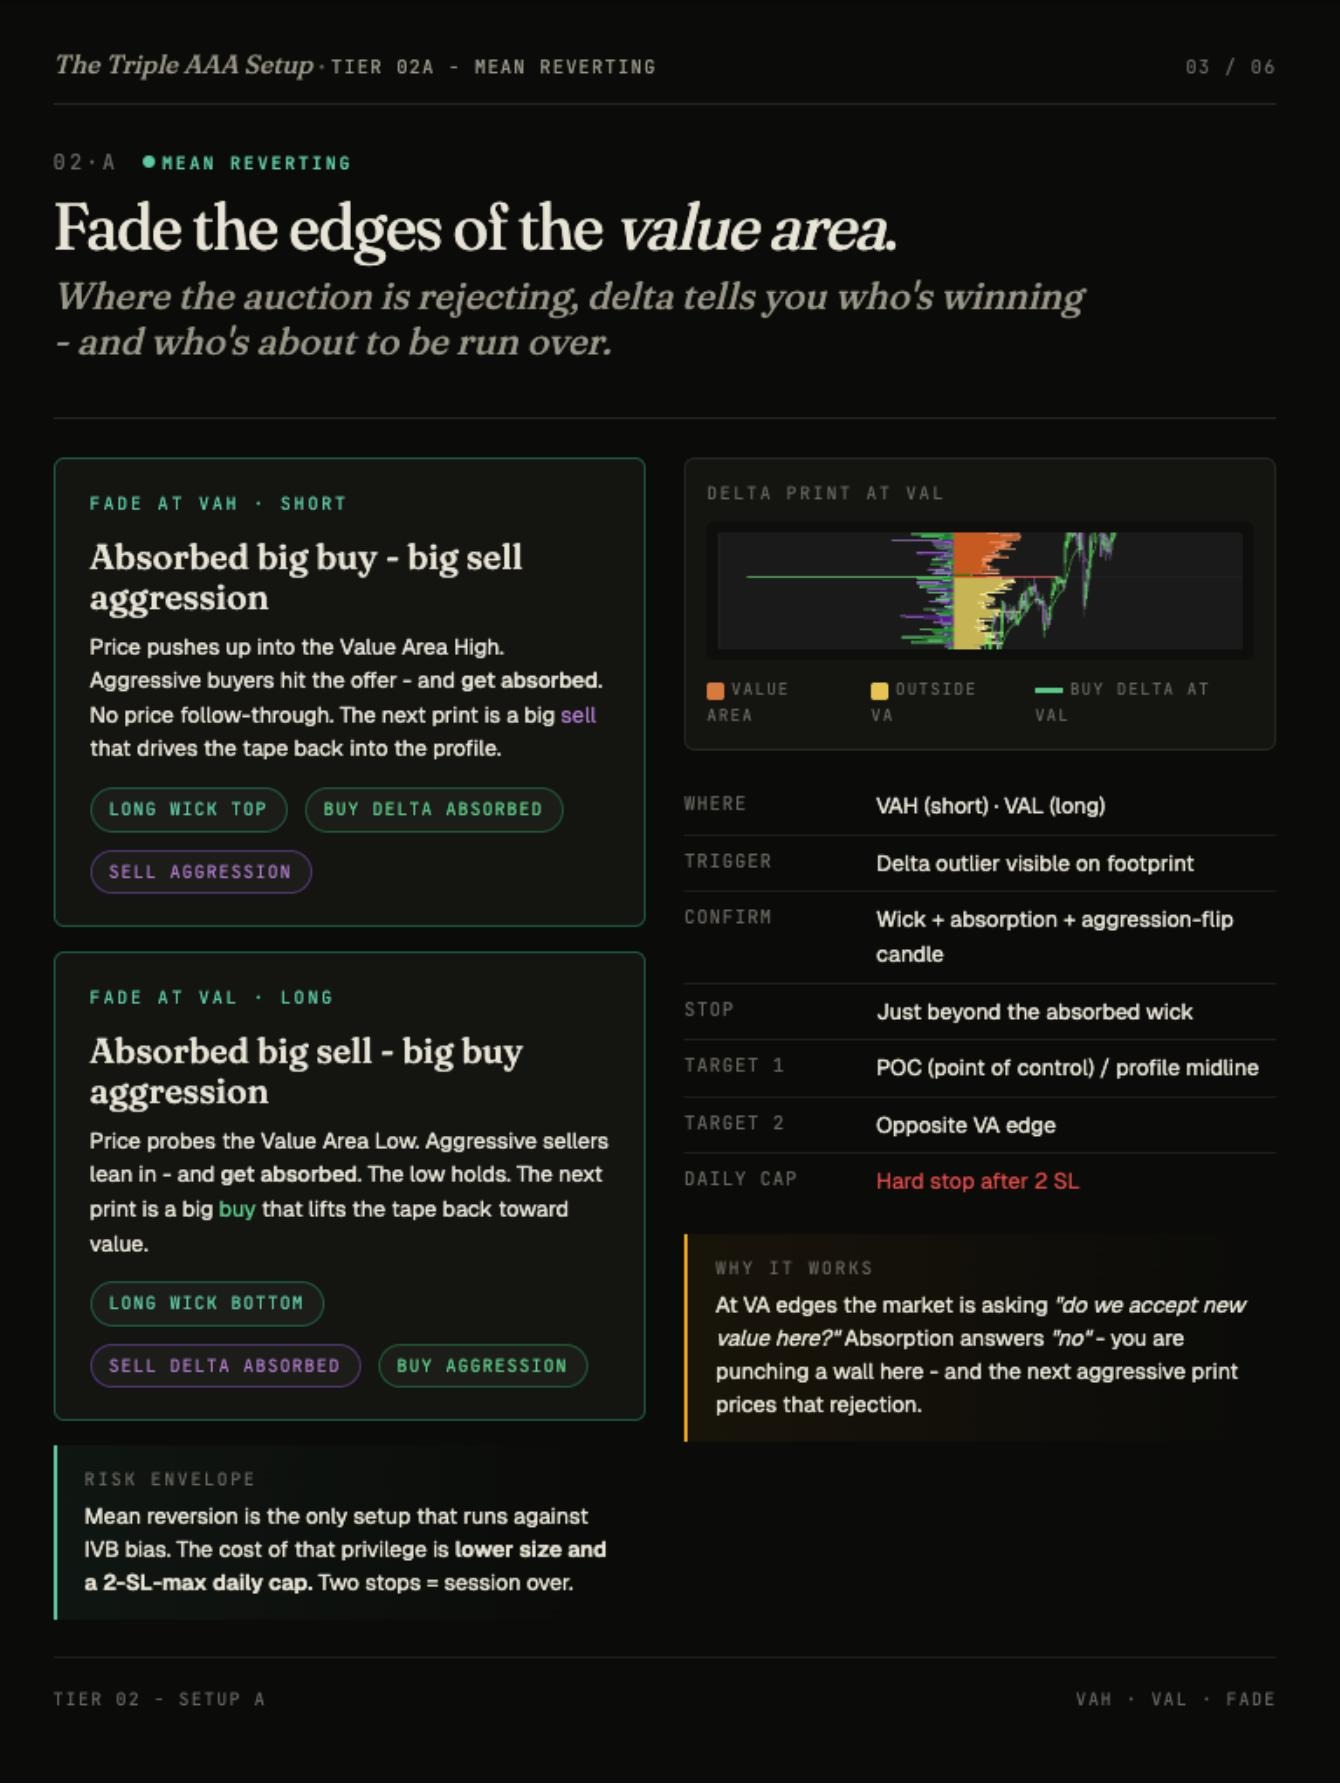
Fade at VAH (top of the value area)
Price pushes to the top of the value area, aggressive buyers hit price and get absorbed without follow-through — the next print is a strong sell that returns price inside.
Fade at VAL (bottom of the value area)
Price probes the bottom of the value area, aggressive sellers get absorbed and the low holds — the next print is a strong buy that lifts price toward value.
| Trigger | A clear delta outlier on the footprint at the edge |
| Confirmation | Wick + absorption + a candle that reverses the aggression |
| Stop | Just behind the absorbed wick |
| Target 1 | The Point of Control (POC) / the profile midline |
| Target 2 | The opposite edge of the value area |
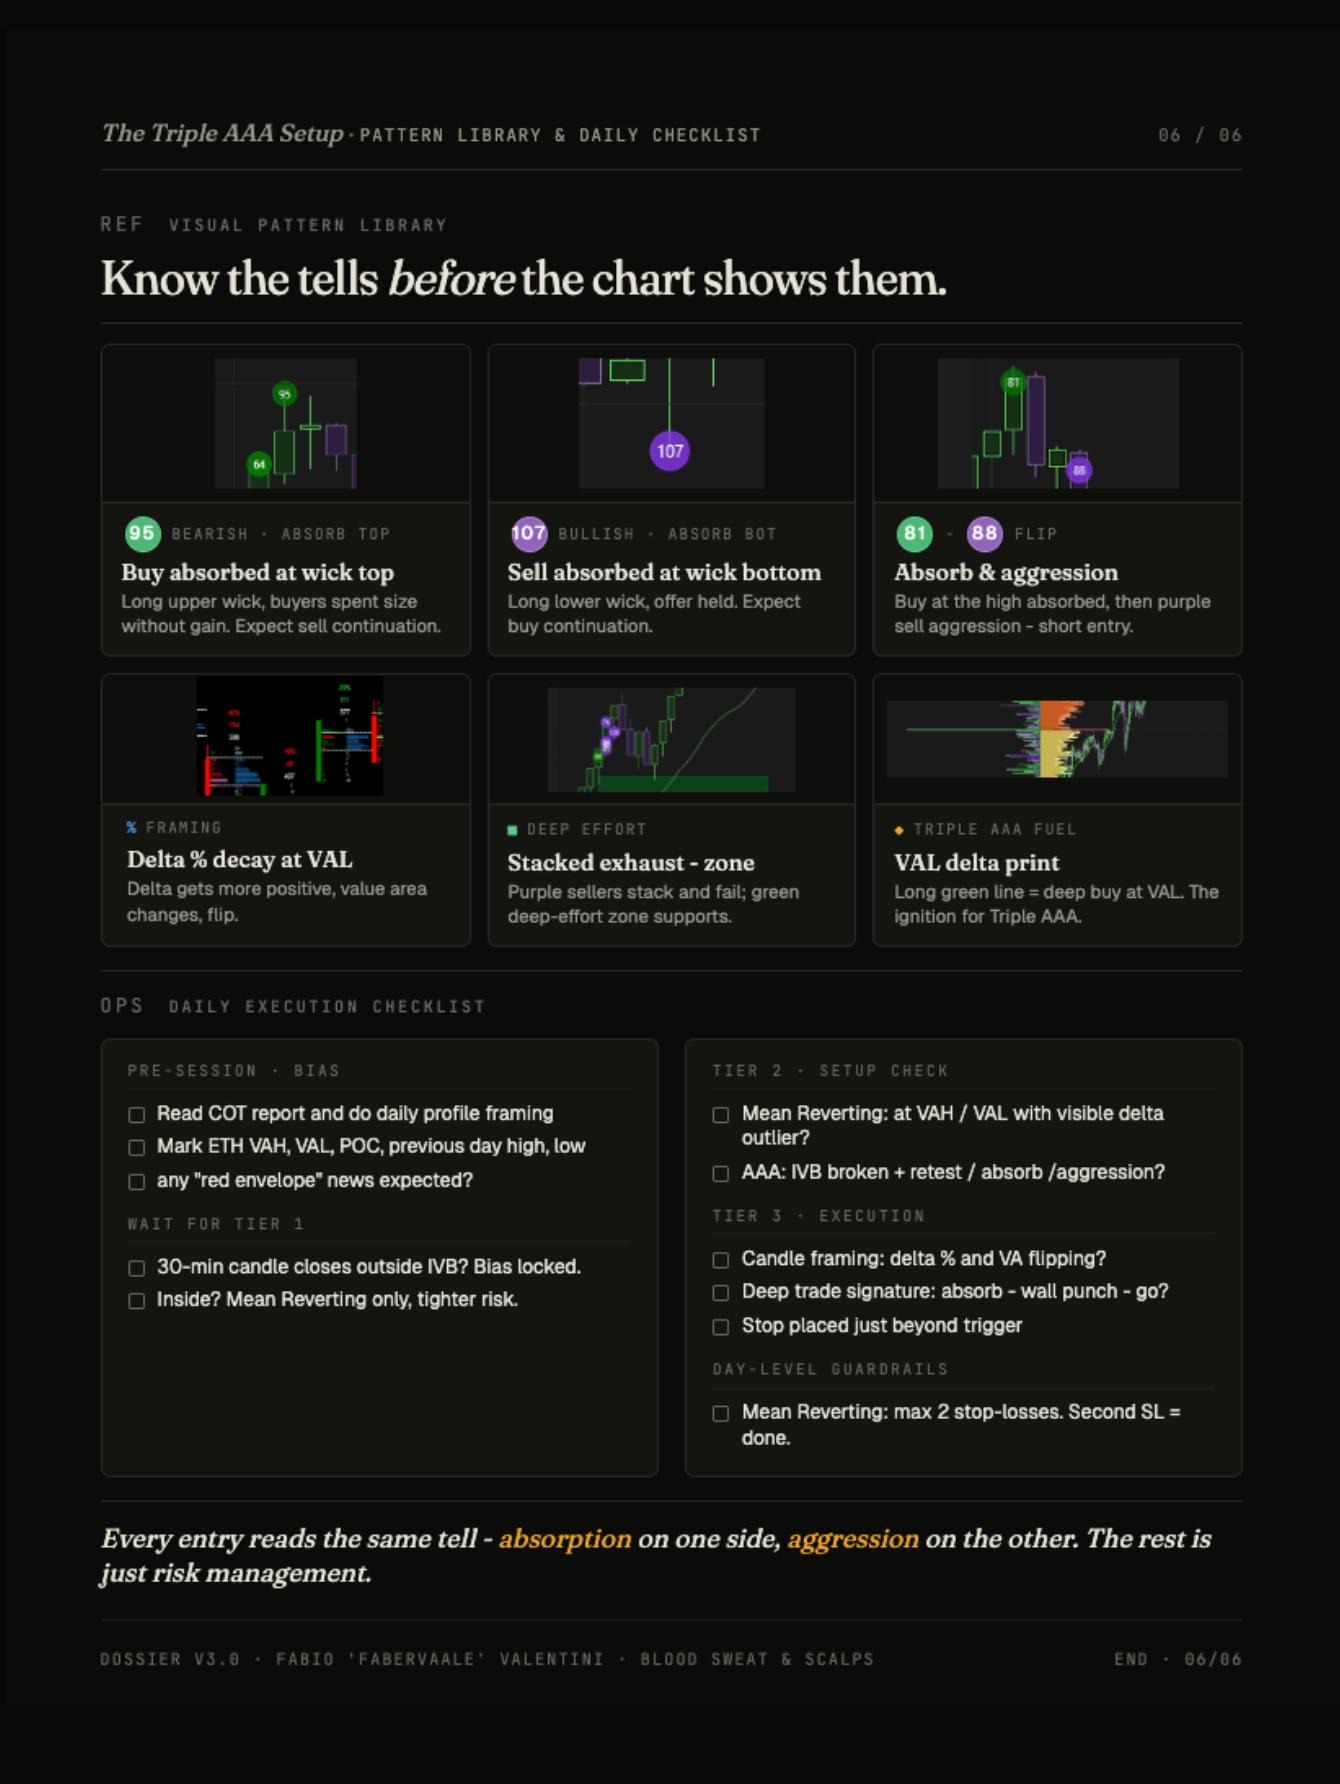
The reference pattern library
A visual set of the absorption shapes this setup specifically looks for on the footprint — "know the tell before the chart shows it."
The daily risk limit
This setup trades against the day's permitted direction, since it has not been decided yet — so it is taken at smaller size and with a strict cap on the number of attempts.
- Risk size
- Smaller than trend-following trades — the price of trading against the day's declaration
- Stop placement
- Always structural, behind the wick/level where the absorption occurred
- Invalidation
- If the level that held against the absorption later breaks, exit immediately without waiting
Trend following after the range breaks