
What Is a High-Volume Node?
Every candle you see on a standard price chart hides a mountain of information beneath it. When you switch to a footprint chart, that hidden data becomes visible — and one of the most important pieces of information it reveals is the high-volume node (HVN).
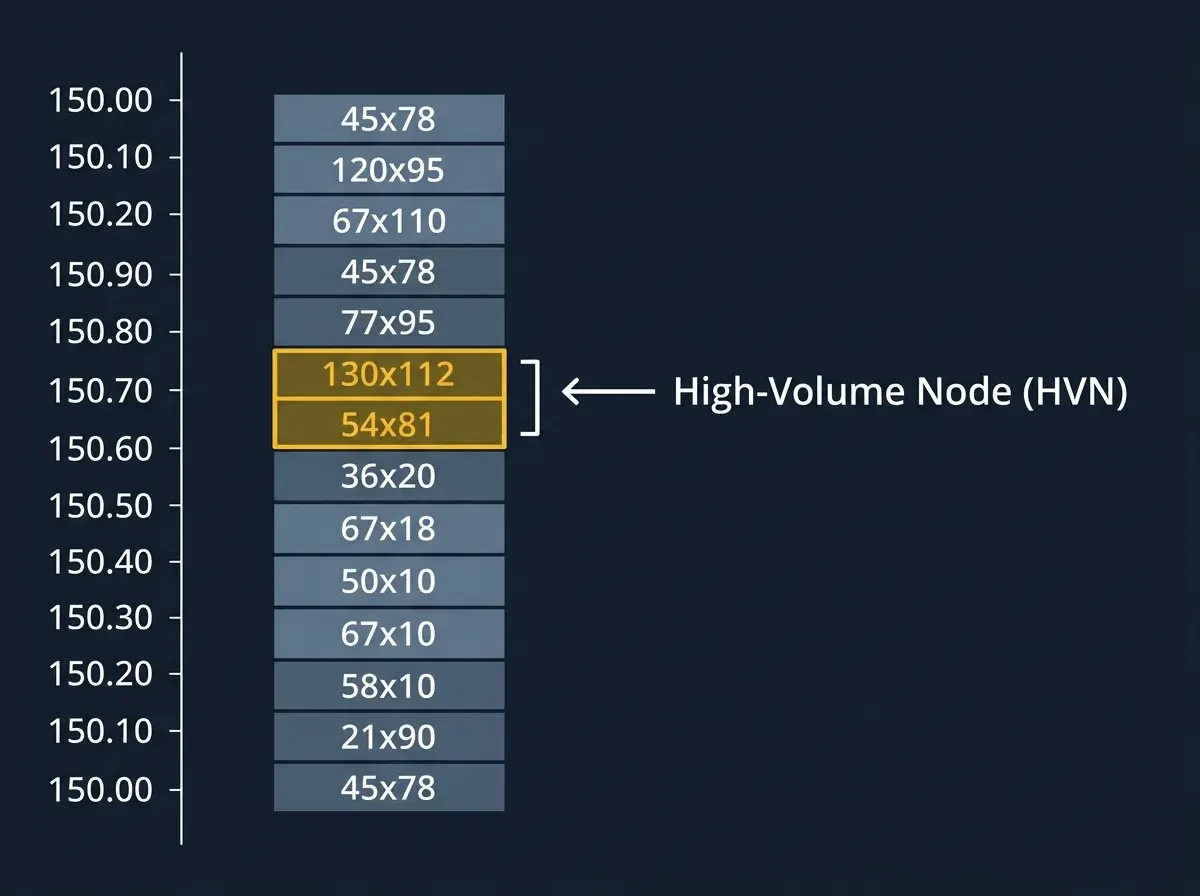
A high-volume node is the single price level within a footprint candle that recorded the heaviest total traded volume during that period. Think of a footprint chart as slicing each candle horizontally into price rows, where each row shows exactly how many contracts changed hands at that specific price. The row with the largest number is your high-volume node.
Most Order Flow trading platforms mark this level automatically, often with a pair of brackets [ ] around the numbers or by highlighting the row in a distinct color. Even if your software doesn't mark it automatically, it's not difficult to spot: it's simply the row with the biggest numbers.
Why Single Nodes Are Just the Beginning
A single high-volume node on its own is a useful data point. It tells you where the heaviest trading activity occurred during one period, which is valuable context. However, treating any single HVN as a standalone trade signal would be like using just one piece of evidence to make a major decision — useful, but incomplete.
The real power emerges when you zoom out and look across multiple footprint candles in sequence. What you're looking for is a situation where the high-volume node from one candle sits adjacent to — or overlaps with — the high-volume node from the next candle. When this happens, you're no longer looking at a single data point. You're looking at a zone where the market consistently returned to conduct heavy business across multiple time periods.
This is the foundation of high-volume node pullback trading, and it's where the strategy earns its edge.
The Power of HVN Clusters: When Two or Three Align
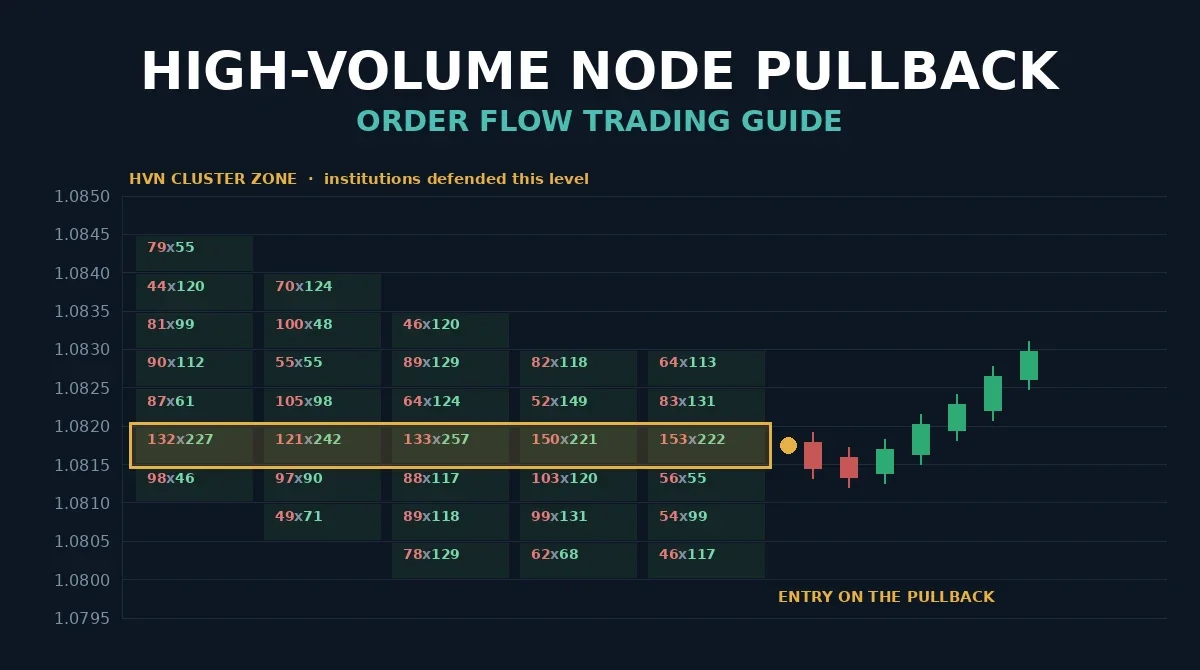
When two high-volume nodes from adjacent footprint candles fall at the same price level or directly next to each other, they form what traders refer to as an HVN cluster or double high-volume node zone.
Some platforms automatically highlight these clusters in yellow or amber. If yours does, you'll notice these highlighted zones appearing periodically across your chart. If it doesn't, you can identify them manually by scanning your footprint chart for consecutive candles where the bracketed row appears at the same — or adjacent — price levels.
Here's why this matters: a double HVN cluster tells you that heavy volume traded at a specific price not just once, but across two separate time periods. That's a fundamentally different signal from a single HVN. It suggests the market kept returning to that price, which implies that significant participants — institutions, large funds, professional traders — were active there and considered it a strategically important level.
But the hierarchy doesn't stop at two. When you observe three high-volume nodes aligned consecutively, you have what can be called a triple HVN cluster. This is a rarer configuration, but when it appears, it carries even more weight. Three consecutive periods of heavy activity at the same price point is a strong signal that institutional involvement was sustained and deliberate, not accidental.
What HVN Clusters Tell You About Institutional Activity
To understand why HVN clusters work, you need to think about how large institutions operate in the market.
Unlike retail traders who place orders at market price without much concern for their impact, institutions deal in enormous size. A hedge fund or bank that needs to execute a position worth hundreds of millions of dollars can't simply click "buy" and expect the market to accommodate them cleanly. Instead, they need to spread their execution across time and across price levels — a process that leaves traces in the volume data.
When you see an HVN cluster, you're seeing the footprint of exactly that kind of institutional accumulation or distribution. The market spent real time at that price, real size was traded there, and real decisions were made around that level.
Here's the insight that makes this tradeable: institutions that built positions at a particular level have a financial incentive to defend that level if price returns. If they bought heavily at 1.0840 across two or three candle periods, they're unlikely to sit back passively when price retraces to 1.0840 again. This defense — whether through additional buying or strategic order placement — is what produces the reaction that HVN pullback traders are positioned to capture.
How to Trade HVN Pullbacks: Step-by-Step
The mechanics of this setup are straightforward, which is part of why it works well even for traders who are newer to Order Flow analysis.
Step 1: Identify the Trend
Before looking at any volume data, establish the directional context of the market. Is price in a clear uptrend (higher highs and higher lows) or a downtrend (lower highs and lower lows)? HVN pullback trading is a trend-following strategy, so identifying the trend correctly is the foundation of everything that follows.
Avoid applying this strategy in choppy, sideways markets. The cleaner and more defined the trend, the better the setup is likely to perform.
Step 2: Find the HVN Cluster
With the trend established, scan back through the recent price action on your footprint chart and look for two or more consecutive footprints where the high-volume node sits at the same or adjacent price level.
If your platform highlights these clusters automatically, your job is easier — simply look for the yellow or amber highlighted zones that formed during the trending move. If not, review each footprint manually and note where the largest volume rows cluster together.
Step 3: Mark the Zone
Once you've identified an HVN cluster, draw a horizontal price zone on your chart covering the range of the clustered nodes. This doesn't need to be perfectly precise — the goal is to have a clearly marked area that you can reference when price approaches it later.
A simple rectangle or shaded zone works well. The zone should be narrow enough to be actionable, but wide enough to account for the natural spread of volume across adjacent price levels.
Step 4: Wait for the Pullback
This is the discipline-intensive part of the strategy: do not enter the trade before price returns to your zone.
Many traders make the mistake of entering as soon as they identify a cluster, which means they're entering at the same price where institutional activity occurred — not on the retracement back to it. The pullback is what allows you to enter with a favorable risk-to-reward ratio, with your stop placed just beyond the zone and your target in the direction of the prevailing trend.
Patient, zone-based waiting is what separates disciplined HVN pullback traders from those who chase and get caught in the middle of moves.
Step 5: Enter in the Direction of the Trend
When price retraces into your marked zone, enter in the direction of the prevailing trend:
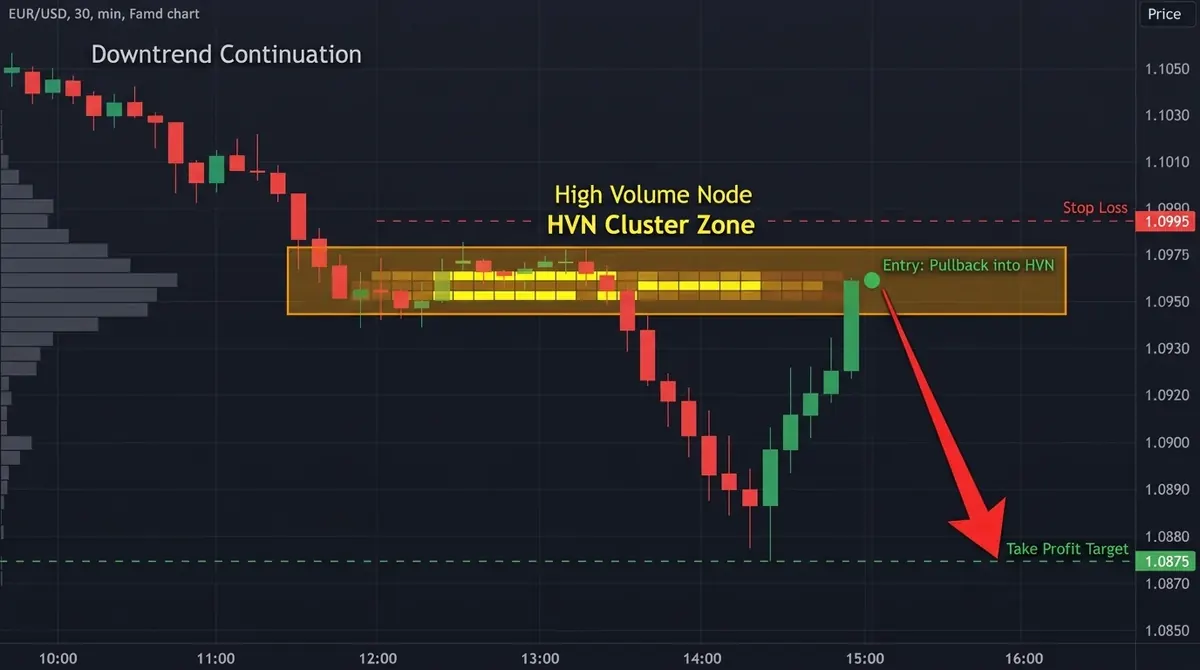
- If the trend is bearish and the HVN cluster formed during a downward move, enter short as price pulls back up into the zone.
- If the trend is bullish and the HVN cluster formed during an upward move, enter long as price pulls back down into the zone.
Place your stop loss beyond the opposite side of the zone (above the zone for short trades, below it for long trades). For your take-profit target, look for the next significant support or resistance level in the direction of the trend.
Trade Direction Reference Table
| Trend Direction | HVN Cluster Type | Trade Direction | Zone Behavior |
|---|---|---|---|
| Downtrend | Double HVN cluster | Short on pullback | Zone acts as resistance |
| Downtrend | Triple HVN cluster | Short on pullback | Stronger resistance |
| Uptrend | Double HVN cluster | Long on pullback | Zone acts as support |
| Uptrend | Triple HVN cluster | Long on pullback | Stronger support |
The key principle is consistency: the same logic applies regardless of trend direction. You're always trading with the trend from a zone that the market has previously validated with heavy volume.
Does This Work on Forex?
One of the most common questions about Order Flow strategies is whether they translate to the forex market, where bid-and-ask volume data is often unavailable or unreliable due to the decentralized nature of currency trading.
The good news about HVN pullback trading is that it does not rely on bid-ask data. High-volume nodes are identified using total traded volume — the combined sum of all activity at each price level, regardless of whether it was executed on the bid or the ask. This makes the strategy directly applicable to forex pairs using platforms that aggregate tick volume or synthetic volume data.
The interpretation is slightly different (tick volume as a proxy for actual volume), but the underlying concept — that price levels with heavy historical volume tend to attract future price interaction — holds across both futures and forex markets.
Best Time Frames to Use
The 30-minute chart is generally considered the most balanced time frame for identifying and trading HVN pullback setups. It offers enough detail to see the HVN clusters clearly without being so granular that you're reacting to short-term noise.
That said, the strategy is flexible:
- 5-minute charts work well for short-term scalping approaches, particularly in liquid futures markets during peak sessions.
- 1-hour charts can be used for swing traders looking for larger moves with fewer entry opportunities.
Avoid going above the 1-hour chart for this specific setup. Higher time frame footprints contain such aggregated data that the HVN clusters lose precision and the pullback entries become too wide to manage with a clean stop.
Common Mistakes to Avoid
Trading against the trend. HVN pullback trading is not designed for counter-trend entries. If the cluster formed during a downtrend, do not use it as a buy signal. The entire logic of the strategy depends on the zone reinforcing — not reversing — the dominant directional move.
Entering without a pullback. Some traders see an HVN cluster form and immediately open a position. This eliminates the key advantage of the strategy: entering at a zone with defined risk. Always wait for price to retrace back into the zone before entering.
Ignoring the broader context. An HVN cluster that forms within an already important area — such as a major historical support/resistance level, a significant high or low, or a key VWAP level — carries more weight than one that appears in an arbitrary stretch of price action. Context amplifies the signal.
Expecting every cluster to produce a reaction. Not every HVN cluster will result in a clean pullback and continuation. Like all trading setups, this one requires disciplined application across a meaningful sample size. Individual trades will fail; the edge lies in consistent application over time.
Final Thoughts
High-volume node pullback trading is one of the most intuitive and repeatable setups available to Order Flow traders. The logic is straightforward: when institutions conduct heavy trading at a specific price zone, they're likely to care about that zone again in the future. By identifying where those zones formed and waiting patiently for price to return, you position yourself to trade alongside institutional activity rather than against it.
The strategy becomes noticeably stronger when two or three HVN clusters align in sequence, as each additional layer of confirmation reinforces the institutional significance of the zone. When this type of cluster also coincides with a broader technical level — a prior support/resistance, a key VWAP, or a volume-based rejection — the probability of a meaningful reaction increases further.
Whether you're trading futures with full bid-ask data or forex with tick volume proxies, the underlying principle applies equally. Practice spotting these clusters on your historical charts before committing capital, and you'll find that they begin to stand out as some of the most reliable reference points available in Order Flow analysis.
FAQ
What is a high-volume node in a footprint chart?
A high-volume node is the specific price level within a footprint candle that recorded the highest total traded volume. It represents the price where the most buying and selling activity occurred during that candle's time period.
How many HVN clusters do I need before the zone is strong enough to trade?
A double HVN cluster (two adjacent nodes) is sufficient to form a valid trade setup. A triple cluster (three in a row) is considered an even stronger signal and often produces a more pronounced market reaction.
Can I use this strategy on forex pairs?
Yes. Because HVN pullback trading uses total volume rather than bid-ask data, it translates directly to forex markets. Tick volume serves as a workable proxy in currency markets where true futures volume isn't available.
What time frame works best for HVN pullback trading?
The 30-minute chart offers the best balance between signal clarity and practical entry timing. The 5-minute and 1-hour time frames can also work, but going higher than the 1-hour chart tends to reduce the precision of the HVN zones.
Where should I place my stop loss?
Place your stop loss on the opposite side of the HVN cluster zone. For short trades, put the stop above the top of the zone. For long trades, put it below the bottom of the zone. This ensures your risk is clearly defined relative to the zone you're trading from.
Does this strategy work in a sideways market?
It performs best in clearly trending markets. In sideways or choppy conditions, HVN clusters lose their directional context, and the pullback entries become less reliable.
Related Reading
- Big Player Confirmation — A Four-Signal Checklist Before You Trust a Move
- Absorption Setup — Trading Reactions at Key Levels
Disclaimer: Educational content for traders. Not financial advice, not a signal service, and no outcome is guaranteed. Test every rule yourself before risking capital.
Comments (0)
Comments are moderated. Your comment will appear after it's approved.
Comments are moderated. Your comment will appear after it's approved.
Loading comments…