
Absorption Marks a Level. This Is How You Trade the Reaction
Our earlier piece on absorption explained the concept: large resting orders quietly soak up aggressive market activity at a price, preventing it from moving further. That article was about recognizing the phenomenon. This one is about trading it.
Absorption by itself is not a trade signal. It is a piece of evidence. The trade only exists once price reacts to that evidence in a way that confirms someone with real size defended the level. This piece walks through the exact setup: how to identify a genuine absorption print, how to wait for confirmation, and how to structure the entry, stop, and target around it.
What Absorption Looks Like on the Tape
On a footprint or DOM, absorption shows up as heavy aggressive volume trading into a price level without that level giving way. Sellers keep hitting the bid, buyers keep lifting the offer, and the level simply refuses to break. Volume spikes; price barely moves.
Three conditions separate real absorption from a temporary pause:
- Volume well above the surrounding average — a quiet stall in low volume is not absorption, it's simply low participation
- Repeated aggressive attempts — the level gets tested more than once in the same session, not a single print
- A visible ceiling or floor on delta — cumulative delta at that price stalls or reverses even as price stays flat
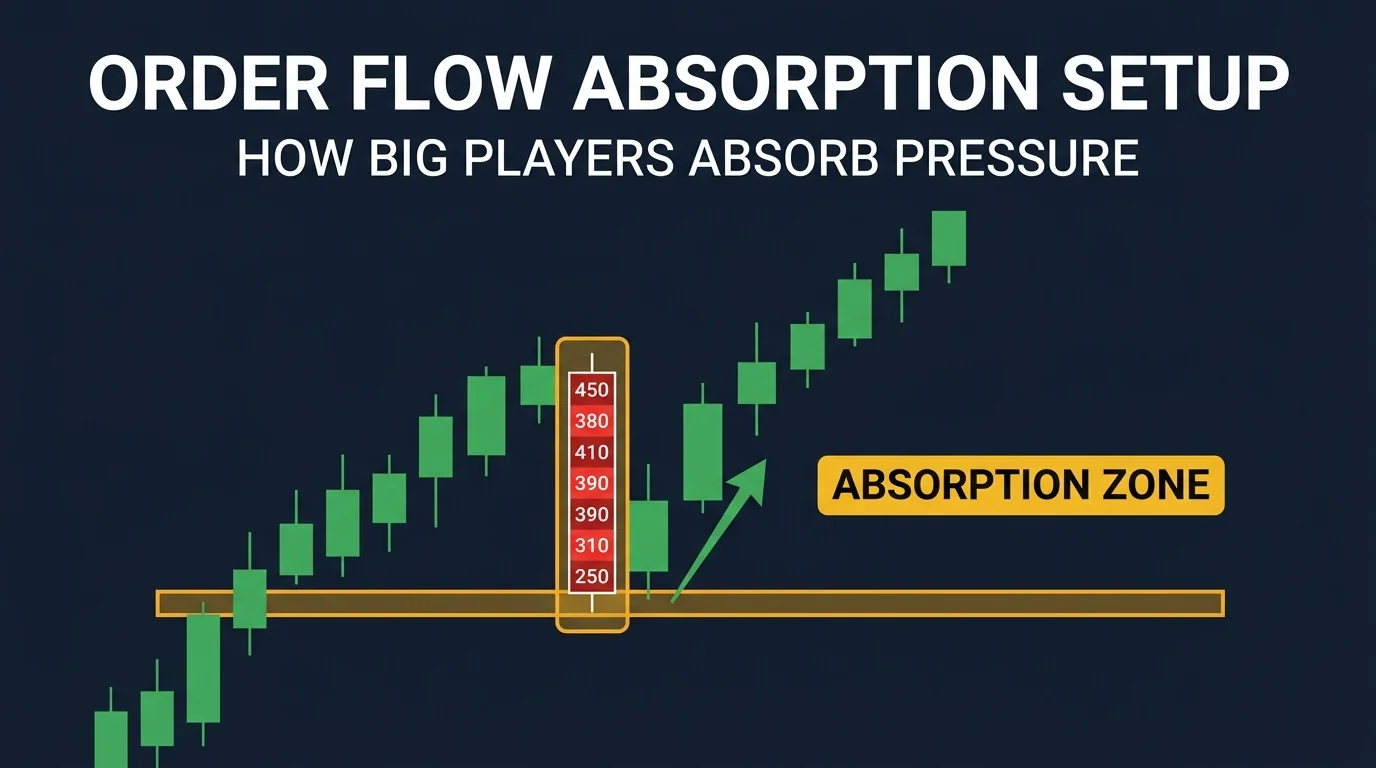
Where to Look for Absorption
Absorption is meaningful only at levels that already matter. Random price points absorb noise for reasons that have nothing to do with institutional defense. Focus your attention on:
- Volume Profile high-volume nodes (HVN) — prior areas of heavy acceptance where resting size is more likely to sit
- Prior day or session high/low — levels every participant is watching by default
- VWAP and its standard deviation bands — mean-reversion anchors that attract institutional flow
- Untested value area edges — the VAH/VAL of a prior balance area
Absorption at an HVN that also lines up with prior day high, for example, is a materially stronger signal than absorption at an arbitrary round number with no other confluence.
The Four-Step Setup
Step 1: Identify the Absorption Print
Watch for the volume-without-movement pattern described above at a level that already carries structural significance. Mark the exact price row on your chart.
Step 2: Wait for the Failed Break
Do not trade the absorption itself. Wait for price to actually attempt to push through the level and fail — a wick, a rejection candle, or a footprint print showing aggressive orders exhausted without progress. This failed break is your confirmation that the absorbing side is still in control.
Step 3: Enter on the Move Away From the Level
Once the failed break is confirmed, enter in the direction opposite the exhausted aggression:
| What Got Absorbed | Trade Direction | Logic |
|---|---|---|
| Aggressive selling into a level (bid held) | Long | Sellers exhausted, buyers defended |
| Aggressive buying into a level (offer held) | Short | Buyers exhausted, sellers defended |
Step 4: Place the Stop and Target
Stop loss goes just beyond the absorption level, on the other side of the defended price — if the level truly breaks after your entry, the read was wrong and the trade is invalidated. Target the next structural level in the direction of the move: the opposite side of the value area, the next HVN, or a prior swing point.
Why the Confirmation Step Matters
The single biggest mistake traders make with absorption is entering the moment they see heavy volume stall price, without waiting for the failed break. Absorption can persist for many bars before finally giving way — or it can simply be the pause before a continuation, not a reversal. Entering early means eating chop while the level is still being tested, often getting stopped out right before the real move develops.
The failed break is what separates a defended level from a level that's merely being probed. Patience at this step is the difference between a structured setup and a guess.
Common Mistakes
Trading absorption with no structural confluence. A volume spike at a random price is just noise. Absorption only earns your attention at HVNs, session extremes, VWAP, or value area edges.
Skipping the failed-break confirmation. As described above — this is the most common way to turn a good read into a losing trade.
Ignoring the broader context. Absorption against the prevailing trend at a minor level rarely holds. Absorption in the direction of higher-timeframe structure is a much stronger read.
Moving the stop after entry. The stop sits beyond the absorption level for a reason — if price reaches it, the level failed and the premise is gone. Widening the stop to avoid being wrong defeats the purpose of defining risk around the level.
Final Thoughts
Absorption trading rewards patience over reaction speed. The setup isn't about catching the exact moment volume spikes — it's about waiting for the market to prove that the absorbing side actually controls the level, then entering with a clearly defined invalidation point. Combine it with Volume Profile and VWAP context so you're only trading absorption at levels that matter, and let the failed break do the confirming for you.
FAQ
How is this different from the general absorption concept?
The concept explains what absorption is and why it happens. This setup is the execution layer: where to look for it, how to confirm it, and how to structure entry, stop, and target once it's confirmed.
Do I need order flow / footprint data to trade this?
It helps significantly, since delta and per-price volume make absorption visible directly. Without footprint data, you can approximate it using candle wicks and volume spikes at key levels, though with less precision. A calibrated order flow trade filter makes the large prints stand out faster.
What timeframe works best?
Absorption setups are commonly traded on 5-minute to 30-minute charts. Lower timeframes show more absorption prints but with lower reliability; higher timeframes show fewer but higher-quality signals.
What if the failed break never comes?
Then there's no trade. Not every absorption print resolves into a clean failed-break setup within a reasonable window. Walking away from an unclear read is part of the process.
Related Reading
- Absorption in Financial Markets: The Moment Hidden Intentions Are Revealed
- High-Volume Node (HVN) Pullback — Institutional Footprints
- Order Flow Trade Filter — Seeing Only Institutional Orders
- Volume Profile: The Complete Guide
- Understanding Value Migration with VWAP
- Big Player Confirmation — A Four-Signal Checklist Before You Trust a Move
Disclaimer: Educational content for traders. Not financial advice, not a signal service, and no outcome is guaranteed. Test every rule yourself before risking capital.
Comments (0)
Comments are moderated. Your comment will appear after it's approved.
Comments are moderated. Your comment will appear after it's approved.
Loading comments…