
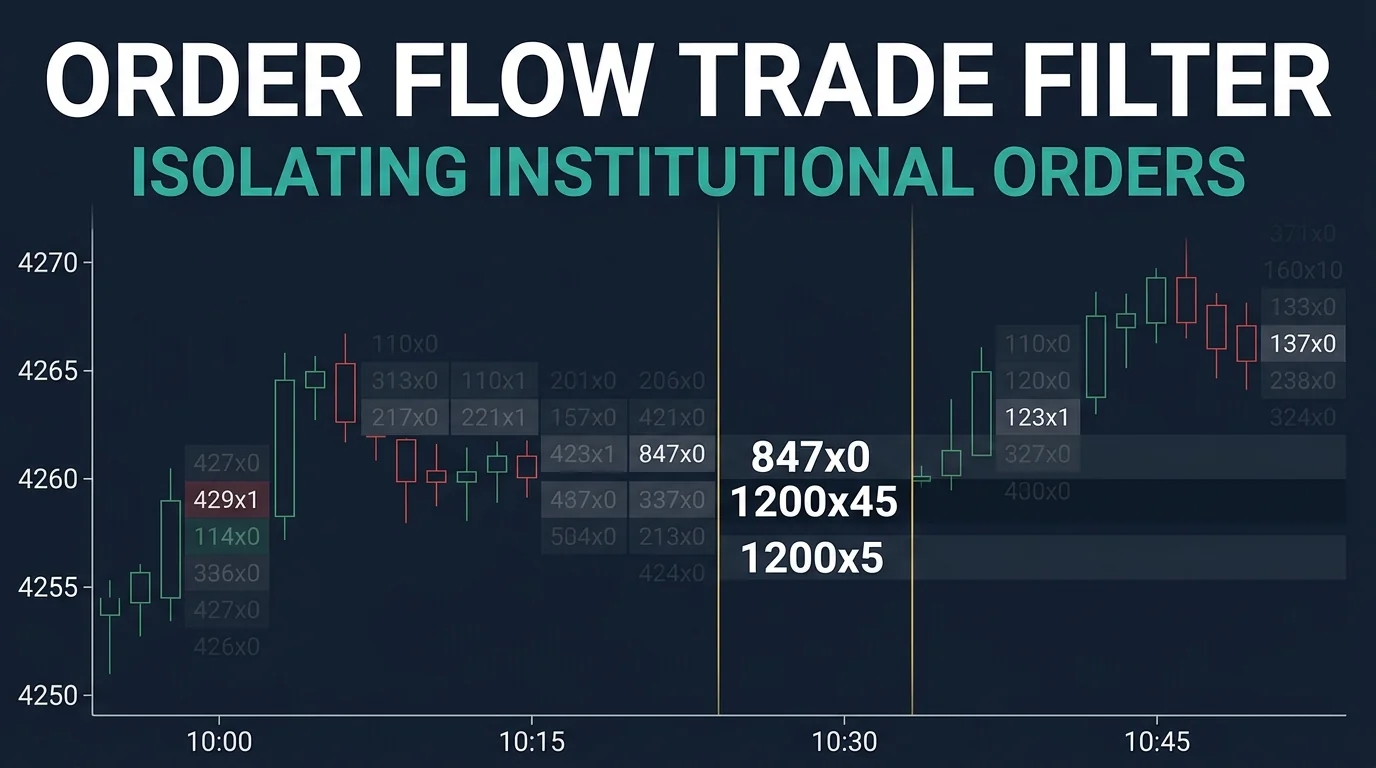
Why Raw Order Flow Charts Feel Overwhelming
Open a raw footprint chart on any liquid market during an active session and your eyes will immediately confront hundreds of numbers firing across dozens of price rows, every few seconds. Small retail traders placing two-lot orders. Algorithmic systems executing dozens of micro-fills per minute. Scalpers in and out before you can blink. All of this activity crowds onto your screen simultaneously.
This is the core paradox of Order Flow trading: the data that reveals institutional behavior is buried under an avalanche of noise from participants whose behavior tells you almost nothing. A two-lot order from a retail trader and a two-thousand-lot block from an institution look identical on a raw footprint. Both show up. Both clutter your screen. Both pull your attention in the wrong direction.
The solution is an order flow trade filter — one of the most practical and underappreciated tools available to footprint traders. Instead of watching every single transaction, you draw a line in the sand: only orders above a certain size get through. What survives is a clean, readable picture of where real institutional money is moving.
What an Order Flow Trade Filter Actually Does
The filter works exactly the way it sounds. Inside your Order Flow platform's data settings, you set a threshold — a minimum trade size — and any transaction smaller than that number becomes invisible on your chart. Smaller retail orders, tiny algo fills, and noise trades all disappear. Only the trades large enough to meet your threshold remain.
The trades that survive this filtering process are almost always institutional in origin. Banks, proprietary trading firms, hedge funds, and large commercial hedgers operate at sizes that retail participants simply cannot replicate. When you see a single order for 400 contracts in a liquid futures market, that is not a retail trader pressing buttons. That is someone with serious capital making a deliberate decision at a specific price.
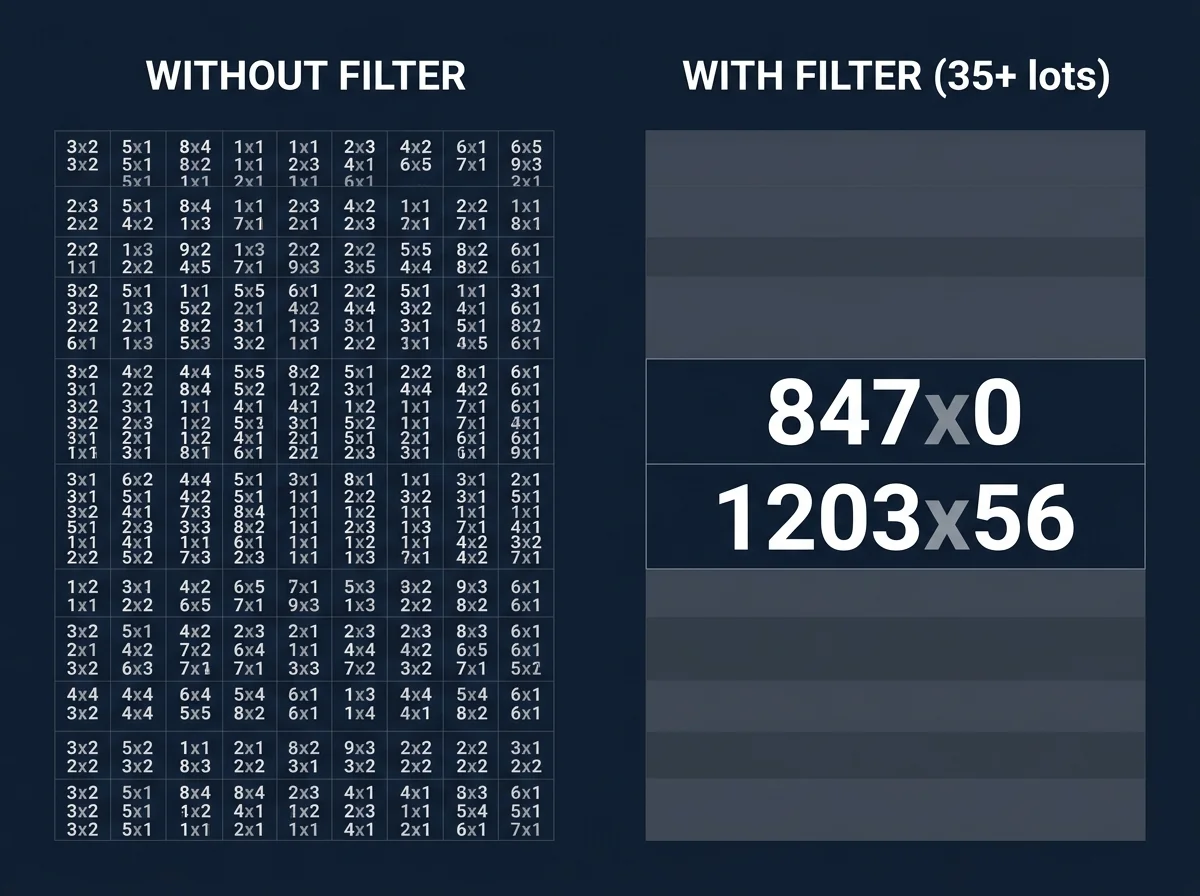
Understanding what the filter reveals is as important as understanding what it hides. The large trades visible after filtering represent:
- Directional conviction — a large order at a specific price shows where a significant player was willing to commit size
- Anchor points — levels where big orders traded often attract price back on later retracements
- Trend confirmation or exhaustion — a cluster of large orders in one direction can signal institutional participation in or against the move
What the filter does not do is predict the future. A large order does not guarantee that price will move in any particular direction. It simply gives you a cleaner map of the market's structure — one that reflects real institutional activity rather than noise.
How to Set Up the Filter on Your Platform
The exact menu names vary between platforms, but the logic is universal. Here is the general process:
- Right-click anywhere on your footprint chart to access the chart's data settings
- Look for a menu labeled Data Series, Chart Settings, or similar
- Inside this menu, find the field labeled Minimum Trade Size (sometimes called Filter Size or Trade Size Threshold)
- Enter your chosen threshold value and apply
Most platforms also let you control how filtered trades are displayed. Switching the display mode to candles rather than raw numbers often makes the chart more readable. This is cosmetic preference — the filter logic doesn't change regardless of display mode.
Once you've set the filter for a specific market, you rarely need to touch it again. The threshold that works for EUR/USD futures today will likely still work next week, because the typical trade sizes in liquid markets remain relatively stable over time.
Finding the Right Minimum Trade Size
This is where many traders get stuck. There is no universal number that works across all instruments. EUR/USD futures, crude oil, gold, and equity index futures all trade at different volume scales. A filter setting of 25 lots might strip out most of the noise in a thinly traded instrument while leaving significant noise in a highly liquid one.
The calibration process is straightforward: start at a moderate number, observe what remains visible, and adjust until the result feels right.
What "right" looks like:
- A handful of clearly significant orders are visible across the session, not dozens
- These surviving orders stand out unmistakably — large numbers in otherwise quiet rows
- The chart feels readable without feeling empty
Calibration guide for a single market:
| Minimum Trade Size | Typical Result |
|---|---|
| 5 lots | Most noise remains — too low for liquid markets |
| 15 lots | Some improvement, still cluttered |
| 30 lots | Getting cleaner — only moderately large orders |
| 50 lots | Very clean — only genuinely large orders survive |
| 100+ lots | Too restrictive for most markets — chart becomes empty |
This table is illustrative. Your actual optimal number will differ by instrument. The calibration process takes 15-20 minutes on historical data and pays dividends every session afterward.
Once you find a threshold that works, write it down for each instrument separately. EUR/USD, NQ, ES, Gold — each will have its own calibrated number. Treat this as a one-time investment in your setup that keeps paying off.
Does Bid or Ask Side Matter?
A natural question: if a large order hit the bid, does that mean sellers are in control? If it hit the ask, does that mean buyers pushed it through? In this setup, the answer is no, and trying to interpret it this way will mislead you.
Here is why: the interpretation of bid versus ask execution in footprint data is far less reliable than it appears. Large institutional orders are frequently executed through a combination of limit and market orders, dark pools, and algorithmic splitting — all of which can appear on either side of the tape regardless of the institution's actual directional intent. A large buyer can execute primarily on the bid side through patient limit order placement. A large seller can appear on the ask side for similar structural reasons.
Forex-specific data adds another layer of complexity. Many forex data feeds report the majority of large trades on the bid side by default — not because selling pressure dominated, but because of how the data architecture routes and reports transactions. Reading directional meaning into this would produce conclusions that are simply wrong.
The practical rule: Focus on two things only — the size of the trade and what price does afterward. If price moves decisively away from the level where a large order appeared, that directional move is your information. The bid/ask label adds noise, not clarity.
The Pullback Setup Built on the Filter
Once your filter is calibrated and running, you have the foundation for a clean, repeatable trading setup. The concept is simple enough that it can be reduced to four steps:
Step 1: Spot a Filtered Order That Stands Out
Look for a single order that clearly dwarfs the others that have survived your filter. If your threshold is 30 lots and you see an order for 280 lots appear in a single row, that order demands attention. The size differential is the signal.
Step 2: Observe the Directional Move That Follows
Watch what price does immediately after the large order appears. In a meaningful setup, price should move away from that level with some momentum. Upward move from the level suggests buying interest was dominant. Downward move suggests selling pressure prevailed. The move validates that the large order had market impact.
Step 3: Mark the Price Level and Wait
Mark the exact price row where the large order appeared. Draw a thin horizontal line or zone on your chart. Do not enter immediately. Your job now is patience: wait for price to retrace back toward that marked level.
Step 4: Enter From the Level in the Direction of the Move
When price returns to your marked level:
- If the original move was upward, look for a long entry as price pulls back down to the order level
- If the original move was downward, look for a short entry as price pulls back up to the order level
Place your stop loss on the opposite side of the level with a small buffer. Target the next meaningful structural level in the direction of the original move.
| Original Move | Trade Direction | Stop Placement |
|---|---|---|
| Price rallied up from order | Long on pullback | Below the order level |
| Price dropped from order | Short on pullback | Above the order level |
The underlying logic: if a large institution placed significant size at a specific price, they have financial motivation to defend that level if price returns. Their defense creates the reaction you're entering from.
Real-World Application Across Markets
The order flow trade filter works across asset classes wherever reliable volume data exists:
Futures markets — The highest data quality. Bid/ask volumes are precise, large orders are clearly visible, and the filter calibrates predictably.
Equity futures (ES, NQ, YM) — Highly liquid, clear institutional footprints, the filter is particularly effective during US market open hours.
Energy and commodity futures — Works well on crude oil (CL) and gold (GC) during peak liquidity windows.
Forex — Works with some caveats. Use tick volume as a proxy for real volume. The filter still strips out smaller retail fills and highlights relatively larger institutional positioning, but the data is less precise than in futures markets.
The setup does not apply to illiquid or thinly-traded instruments where volumes are too low to distinguish retail from institutional meaningfully. In those markets, even a small retail order can appear large by comparison.
Common Mistakes Traders Make
Setting the filter too low. The most common error. A threshold that's too lenient lets through too many moderately-sized orders, which defeats the purpose. The chart stays cluttered and the genuine institutional orders don't stand out. Raise the threshold until only clearly anomalous orders remain.
Setting the filter too high. The opposite problem. If you filter so aggressively that almost nothing survives, you lose context entirely. The chart tells you nothing. Find the middle ground where clarity and information coexist.
Entering before the pullback. The large order marks a level. That level only becomes your entry after price moves away and then returns. Chasing the original move from the order price — without waiting for a pullback — eliminates the risk management advantage the strategy offers.
Reading directional meaning into bid vs. ask. As discussed earlier, this leads to wrong conclusions more often than right ones. Ignore the side. Watch the resulting price movement.
Expecting every filtered order to produce a setup. Some large orders appear in the middle of sustained moves where no pullback develops. Others appear near structural extremes where the level is immediately violated. Accept a selectivity rate: not every filtered order becomes a trade. Look for the clearest setups and skip the ambiguous ones.
Final Thoughts
The order flow trade filter is one of those tools that feels almost too simple until you try it. A few minutes of calibration transforms an overwhelming chart into something genuinely readable. The market's signal — where real money is positioned and what prices those participants care about — becomes visible without the constant background noise of retail activity.
The setup built on top of the filter is equally direct. Identify the large order. Watch the directional move. Wait for the pullback. Enter from the level. Four steps, clearly defined risk, rooted in actual institutional activity rather than speculation about where price might react.
As with any setup, consistency over a sample size matters more than individual outcomes. Practice the calibration on historical data first. Mark the filtered orders and trace what price did afterward. Build a feel for how the setup behaves in your specific market before committing capital. Done carefully, the order flow trade filter becomes one of the cleanest lenses available for reading what the market's largest participants are actually doing.
FAQ
What is a good starting minimum trade size for the filter?
Start around 15–20 lots for most liquid futures markets, then adjust upward until only a small number of clearly large orders remain visible. There is no universal number — calibration is market-specific.
Does this work on forex pairs?
Yes, using tick volume as a proxy for real volume. The filter still removes smaller fills and highlights relatively larger orders, though with less precision than in futures markets where exact bid/ask data is available.
Can I use this filter on multiple time frames?
Yes. The filter setting is applied to the data series, not the time frame specifically. The 30-minute chart is often the most practical for spotting and trading from filtered order levels, but the 5-minute and 1-hour also work.
How do I know if the pullback is complete and it's time to enter?
Look for price to approach the level of the original large order. You don't need to see another large order to confirm. The approach to the level itself is the trigger, combined with a stop placed just beyond the zone.
Does the bid/ask side of the filtered order matter?
No. Focus on the size of the order and what price does after it appears. The bid/ask side is unreliable as a directional indicator, especially in forex markets where data architecture distorts the reading.
How often do filtered orders produce valid pullback setups?
Not every filtered order generates a clean pullback. Some moves extend too far. Some levels get immediately broken. Expect a selectivity rate and focus on the setups where the large order clearly stands out and the directional move after it is unmistakable.
Related Reading
- Big Player Confirmation — A Four-Signal Checklist Before You Trust a Move
- Absorption Setup — Trading Reactions at Key Levels
Disclaimer: Educational content for traders. Not financial advice, not a signal service, and no outcome is guaranteed. Test every rule yourself before risking capital.
Comments (0)
Comments are moderated. Your comment will appear after it's approved.
Comments are moderated. Your comment will appear after it's approved.
Loading comments…