
The Core Idea: Rotation, Trend, and Fair Value
Markets do not move in a straight line from A to B. They cycle between two distinct phases: rotation — periods of sideways, back-and-forth price action where large participants build positions — and trend — directional moves that follow once those positions are established.
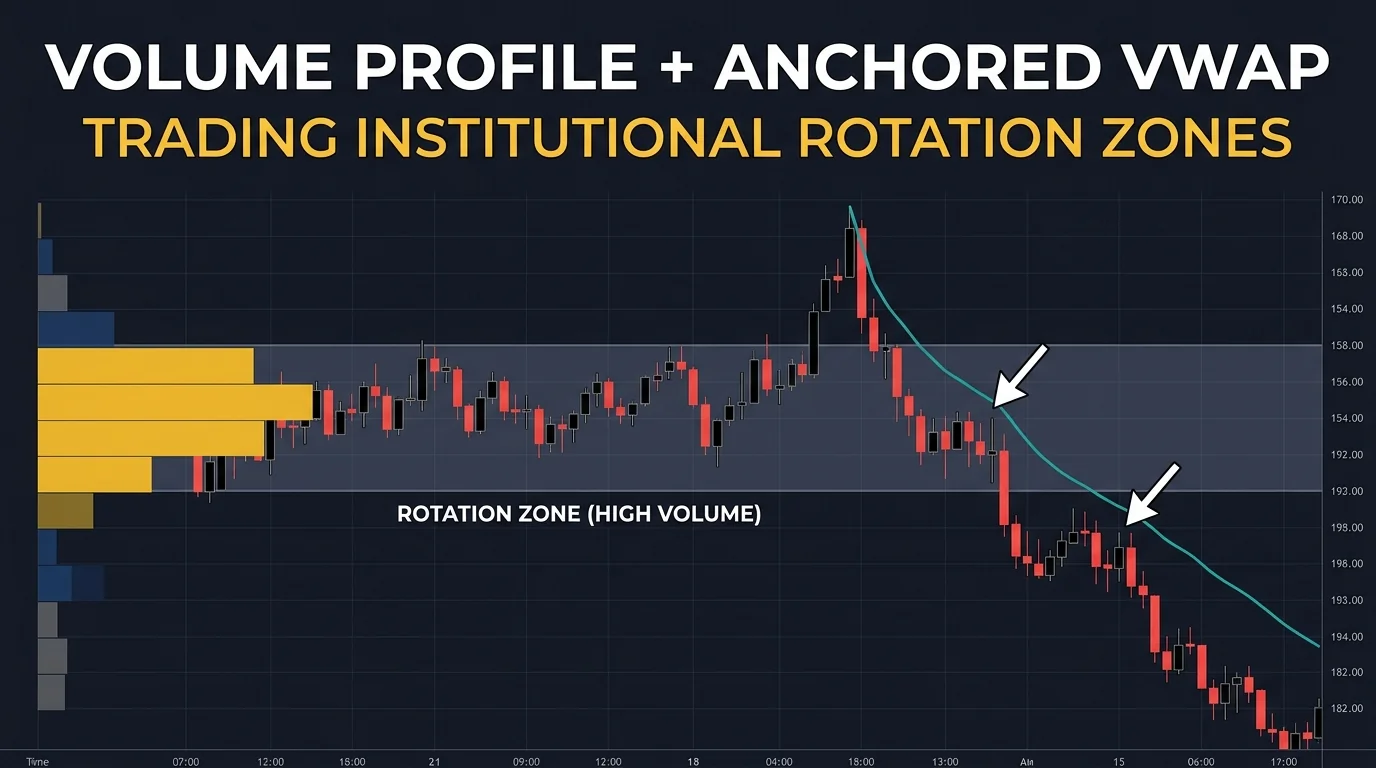
The Volume Profile pullback strategy exploits the transition between these two phases. It starts by identifying where a significant rotation occurred, confirmed by heavy volume concentration in a narrow price range. Then it uses an Anchored VWAP (Volume Weighted Average Price) to mark the fair value level emerging from that rotation. Finally, it waits for price to return toward that VWAP during the subsequent trend, offering a precise, logic-based entry point.
The elegance of this approach is that it does not rely on speculation about where the market might turn. It locates where the market already did conduct a large amount of its business, anchors a fair value reference from that point, and trades the natural return-to-fair-value movement that often follows extended directional moves.
Step One — Finding the Right Volume Profile Zone
The starting point for every trade in this strategy is the Volume Profile indicator, which displays how much volume was traded at each price level rather than at each point in time. Unlike a standard bar or candlestick chart, which shows when price moved, the Volume Profile shows where the most activity took place.
You are looking for a specific structure: a period where price consolidated in a relatively tight range, during which the Volume Profile shows a noticeably thicker bar — a high-volume node — compared to the surrounding price levels. This concentration of volume indicates that a significant number of transactions occurred at that price zone. In market terms, it means large participants spent meaningful time executing positions there.
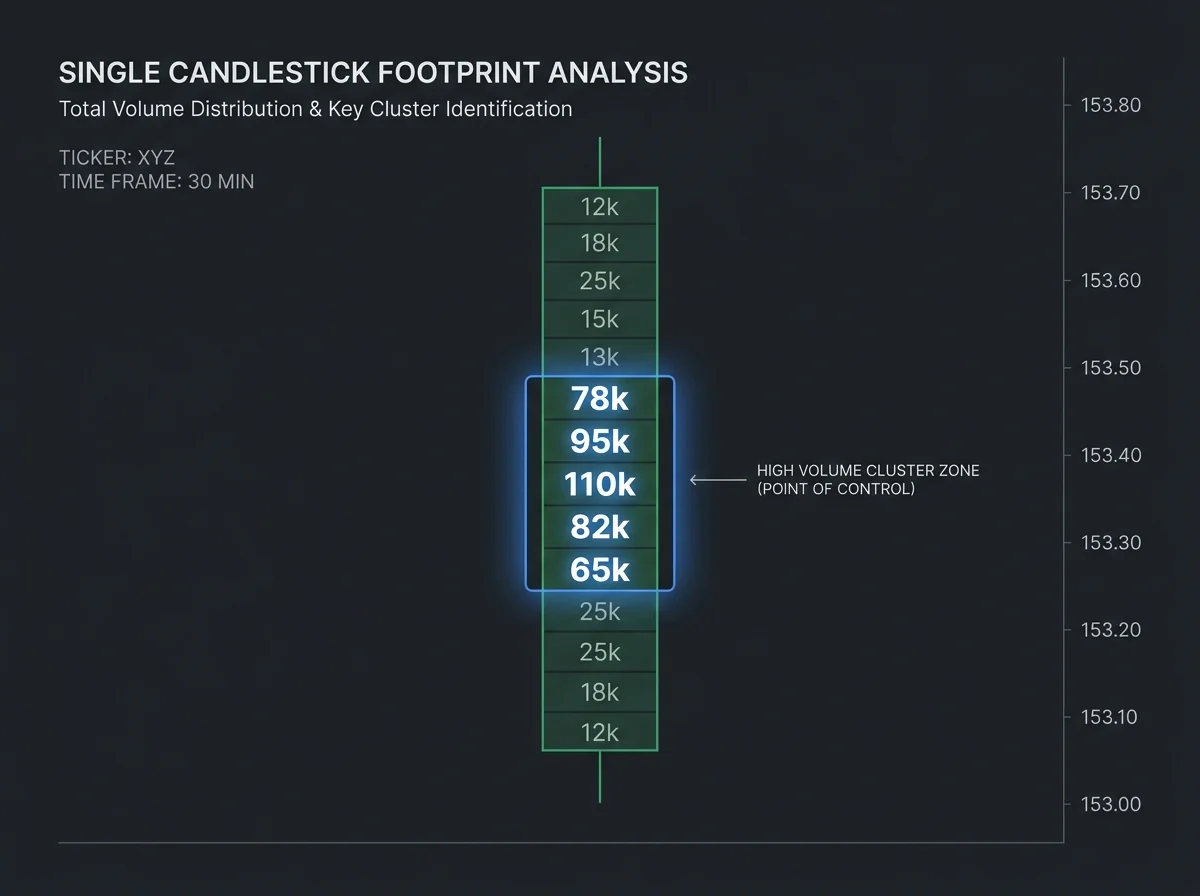
The critical additional requirement: the rotation must be followed by a strong, clearly directional trend. The volume concentration alone is not sufficient. It needs to be validated by a decisive breakout in one direction after the rotation ends. This confirms that the sideways activity was genuine accumulation or distribution rather than random noise.
What a Valid Rotation Zone Looks Like
Developing an eye for valid rotation zones takes practice, but the characteristics are consistent:
Visually recognizable consolidation: Multiple candles moving within a relatively tight range, often creating a "box" shape on the chart. Not a single candle or brief hesitation — a genuine sideways period of at least 3-5 candles.
Above-average Volume Profile bar: The volume histogram at the rotation price range should be distinctly wider/thicker than neighboring levels. This visual contrast is your primary indicator that the rotation was genuinely significant.
A clean breakout candle: The rotation ends with a candle that clearly breaks away from the range. This is often a larger-than-average candle in the direction of the subsequent trend — a decisive signal that the accumulation/distribution phase is complete and the directional move has begun.
The breakout holds: The market does not immediately reverse back into the rotation zone after breaking out. If price yo-yos immediately back inside the range, the setup is compromised. A valid zone produces a trend that persists at least several candles before any meaningful pullback.
Scanning for these structures becomes significantly easier once you have the Volume Profile displayed alongside your price chart. The thick volume bars at rotation zones tend to jump out visually when you train your eye to look for the contrast.
Step Two — Anchoring VWAP to the Trend's Starting Candle
Once you've identified a valid rotation zone and the subsequent trend, the next step is placing your Anchored VWAP. This is where the strategy transitions from observation to actionable tool.
Anchored VWAP calculates the volume-weighted average price starting from whatever specific candle you choose, then extends forward in time. Unlike the standard daily VWAP that resets every session, an anchored version stays fixed to your chosen starting point indefinitely, updating in real time as new candles form.
Where to anchor it: Place the VWAP anchor on the last candle of the rotation zone — the breakout candle that initiated the trend. This candle represents the moment the market transitioned from accumulation/distribution to active directional movement. Anchoring here creates a VWAP line that reflects the fair value of the market from the exact point where institutional intent became directionally clear.
For a downtrend setup: If the rotation ended with a strong bearish breakout candle (a large red/bearish candle), anchor the VWAP to the start of that candle. Your VWAP line will slope downward with the trend.
For an uptrend setup: If the rotation ended with a bullish breakout (large green/bullish candle), anchor to that candle. The VWAP line slopes upward with the price action.
Why Precision Doesn't Need to Be Perfect
A common concern for traders new to anchored VWAP is choosing the "wrong" candle. This concern is largely unfounded. Anchoring one or two candles early or late from the ideal point changes the VWAP line only marginally. The line's general level and slope remain directionally consistent.
What matters more than perfect anchor placement is the overall structure: you need a genuine rotation with confirmed volume concentration, followed by a real directional breakout. If both are present, the VWAP anchor will produce a useful reference line regardless of minor precision differences.
This also means you can apply the strategy retrospectively — viewing historical charts, placing the anchor, and studying how the resulting VWAP behaved. This practice is extremely valuable for building pattern recognition without the pressure of live market conditions.
Step Three — Trading the Pullback to Anchored VWAP
With your anchor placed and the VWAP line drawn, the strategy enters its third and most actionable phase: waiting for price to return to the VWAP and entering from that level in the direction of the established trend.
The underlying logic is straightforward: after a strong directional move away from the rotation zone, price frequently pulls back toward the fair value established by the anchored VWAP. This pullback is a regression toward equilibrium — a natural market behavior where participants who missed the initial move look to enter at a more favorable price.
Entry process for a short setup:
- Rotation zone with heavy volume identified ✓
- Strong downtrend confirms the breakout ✓
- VWAP anchored to the breakout candle ✓
- Wait for price to rally back up toward the VWAP line
- As price approaches the VWAP from below (in a downtrend context), prepare for a short entry
- Enter short when price shows signs of rejection at the VWAP — a bearish candle, a momentum shift, a failed push above
- Stop loss above the VWAP with a small buffer
- Target: the next significant support level below, or the next Volume Profile level of interest
Entry process for a long setup:
The mirror image: anchor VWAP to a bullish breakout, wait for price to pull back down toward the VWAP, and enter long as price approaches and shows rejection of the VWAP from above.
| Trend Direction | Trade Type | VWAP Acts As | Entry Signal |
|---|---|---|---|
| Downtrend | Short | Resistance | Price fails to push above VWAP |
| Uptrend | Long | Support | Price fails to break below VWAP |
One critical patience requirement: do not enter before price reaches the VWAP. The value of the setup comes from entering at the fair value level, not at an arbitrary point during the trend. Wait for price to actually touch or come very close to your VWAP line.
The Support-to-Resistance Flip
One of the more powerful extensions of this strategy involves what happens when price decisively breaks through the anchored VWAP in the opposite direction.
Consider a short setup where price has been below an anchored VWAP and pulling back to it repeatedly. Eventually, price manages to push convincingly above the VWAP and close there. This is a significant structural shift. The VWAP, which previously functioned as resistance, has now become a potential support level as the trend dynamics change.
This flip happens because the fair value reference has been accepted by the market at a new level. Traders who were previously selling into the VWAP are now reassessing their bias. The level that was resistance becomes a reference for buyers looking to enter on dips.
Practical application of the flip:
- When price closes convincingly above a VWAP that was previously acting as resistance, look for the first pullback down to that same VWAP as a long entry opportunity
- The reversal should be confirmed by price action — a failed attempt to push back below the VWAP after the flip, combined with bullish candle structure
This flip dynamic adds a second trade opportunity to every anchored VWAP you place, without requiring any additional analysis. The same line provides both the short setup (while it acts as resistance) and potentially the long setup (after it flips to support).
When to Stay Out of the Market
The pullback strategy requires trend context to work reliably. When the market is in a rotation phase rather than a trend, the anchored VWAP becomes an unreliable reference. Price may touch it, pass through it, and reverse repeatedly without producing clean entries.
Signs that conditions are unfavorable for this setup:
- Price is trading back-and-forth through the VWAP without respect for the level
- The Volume Profile shows no clear concentration zone to anchor from
- The most recent breakout from a rotation immediately reversed back into the range
- Market conditions are exceptionally volatile without directional follow-through
During these periods, the correct action is simply to wait. Do not force entries onto a VWAP in a choppy market. The setup derives its value from trend context — remove the trend and you remove the edge.
A practical filter: only anchor your VWAP to rotations where the subsequent trend moved at least 1.5x-2x the width of the rotation zone before pulling back. This ensures the trend has genuine momentum behind it and is not simply random price action.
Practical Examples Across Market Conditions
Example 1 — Short trades from a declining VWAP
A rotation with heavy Volume Profile concentration precedes a strong bearish breakout. VWAP anchored to the breakout candle and declining. Price pulls back to the VWAP twice during the downtrend, offering two clear short entries. Both find resistance at the VWAP and produce downward moves. Later, price breaks through the VWAP to the upside — the flip scenario creates a long opportunity from the same level.
Example 2 — Multiple pullbacks in a sustained downtrend
A strong downtrend with a well-defined rotation zone at the top. The anchored VWAP provides 3-4 pullback opportunities over an extended period. Each pullback is slightly different in shape — some are shallow, some deeper — but the VWAP consistently acts as a dynamic resistance reference throughout.
Example 3 — Failed rotation (avoid)
A sideways period with moderate volume, followed by a breakout that immediately reverses. The Volume Profile bar is not visually distinct — not significantly thicker than neighboring levels. The VWAP anchored here produces unreliable behavior. This is a rotation without institutional conviction and should be skipped.
Common Mistakes to Avoid
Anchoring to any sideways period, not just high-volume rotations. The Volume Profile concentration is non-negotiable. Anchoring VWAP to a random consolidation without confirmed volume concentration produces a line with no meaningful market-structure basis.
Entering before price reaches the VWAP. Impatience is the most common error. If price is 50 pips from the VWAP and looks "close enough," that is not the entry. Wait for actual contact or a near-touch before evaluating the reaction.
Trading VWAP pullbacks against a very strong trend. In extremely strong trending markets, pullbacks may not reach the VWAP at all before the next wave of directional movement begins. Do not lower your VWAP line to chase price — if the pullback doesn't reach your reference, the setup simply doesn't trigger.
Ignoring the flip. When VWAP flips from resistance to support (or vice versa), many traders abandon the line entirely instead of re-evaluating it as a new type of opportunity. The flip is a feature, not a malfunction.
Using the strategy in choppy, trending-less markets. As discussed, the edge disappears when trend context is absent. Confirm trend structure before anchoring.
Final Thoughts
The Volume Profile pullback strategy is one of the cleanest combinations of two independently powerful tools. Volume Profile locates the zones of maximum institutional activity. Anchored VWAP transforms those zones into dynamic, forward-looking fair value references. Together, they produce a trading approach grounded in actual market microstructure rather than indicator mathematics.
The learning curve is manageable. The setup has clear, observable requirements — a volume-confirmed rotation, a directional breakout, and a patient wait for the VWAP pullback. The risk is naturally defined. The flip dynamic adds a second opportunity layer without complexity.
Most importantly, it connects your trading to what large market participants are genuinely doing. When you anchor VWAP to a rotation zone and trade the pullback, you are positioning alongside the institutional players who built positions there and have economic motivation to defend that price level. That alignment — trading with the market's heaviest participants rather than against them — is the foundation of any durable edge.
FAQ
What is the Volume Profile pullback strategy?
A strategy that identifies rotation zones with heavy Volume Profile concentration, anchors a VWAP to the trend's starting candle, and enters trades when price pulls back to the VWAP during the subsequent trend.
How do I know where to anchor the VWAP?
Anchor it to the last candle of the rotation zone — usually the breakout candle that initiated the directional move. Anchoring one or two candles early or late has minimal impact on the VWAP line's level and slope.
What is the VWAP flip and how do I trade it?
When price breaks convincingly through the VWAP and closes on the other side, the VWAP can flip from resistance to support (or vice versa). The first pullback to this flipped level is a fresh entry opportunity in the new direction.
Does this work on all markets and time frames?
Yes. The underlying logic applies wherever Volume Profile data is available. The 30-minute and 1-hour charts offer the most practical balance of setup frequency and trade duration for most traders.
When should I avoid this strategy?
When the market is choppy or rotating without clear directional momentum. If price trades back and forth through the VWAP without respecting it, the setup conditions are not in place. Wait for a clean trend context.
How many pullback entries can I take from one anchored VWAP?
Multiple. In a sustained trend, the same VWAP can provide 2-4 pullback opportunities as price bounces off the level repeatedly before continuing. Stay with the same anchor as long as the trend context remains valid.
Disclaimer: Educational content for traders. Not financial advice, not a signal service, and no outcome is guaranteed. Test every rule yourself before risking capital.
Comments (0)
Comments are moderated. Your comment will appear after it's approved.
Comments are moderated. Your comment will appear after it's approved.
Loading comments…