
What Is a Volume Cluster in Order Flow?
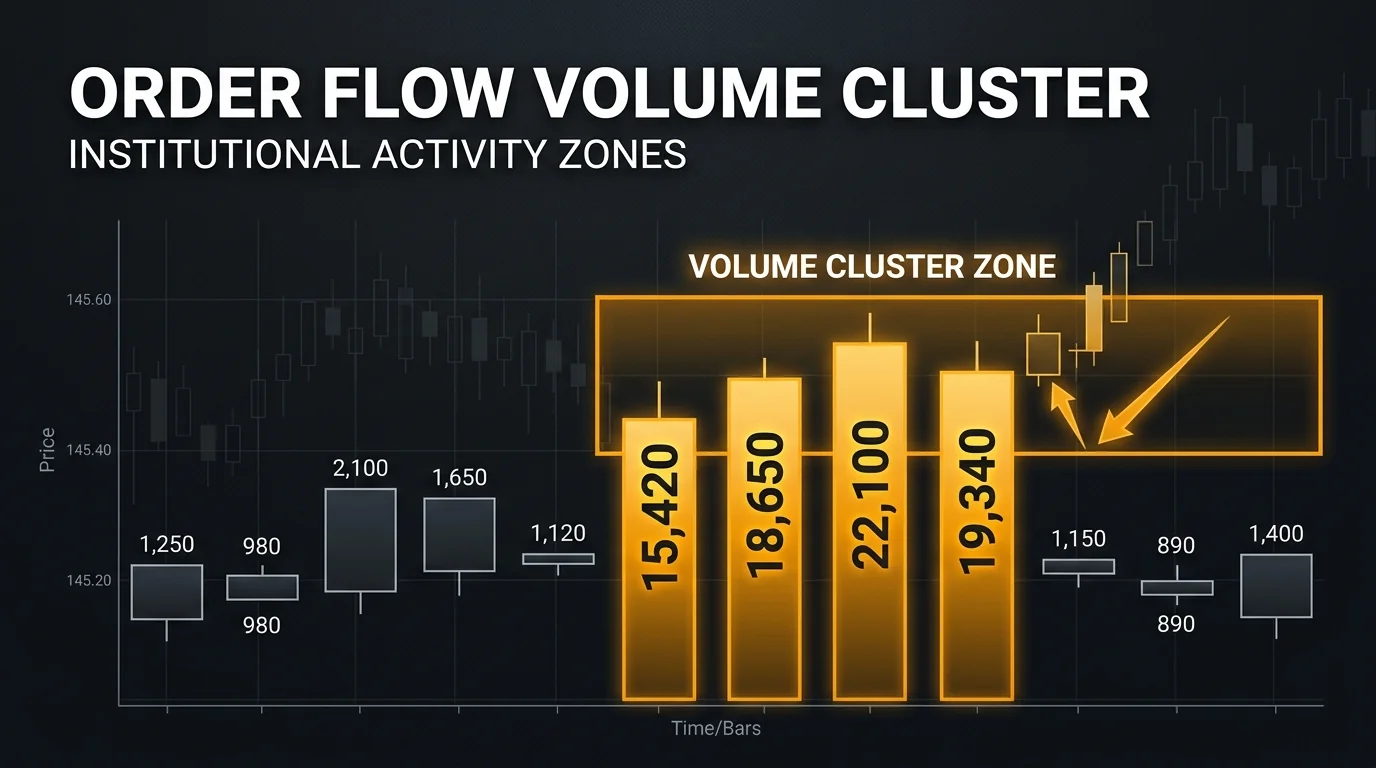
In Order Flow trading, a volume cluster is a group of consecutive footprint candles or price bars in which the total traded volume is significantly higher than the surrounding candles. It is not about the bid/ask split — it is not about whether buyers or sellers dominated — it is simply about the raw quantity of trading activity at a specific price zone over a specific time window.
Think of it as a concentration of market energy. While most candles in a session see normal, moderate volumes as the market drifts between levels, a volume cluster represents a period where the market chose to conduct a disproportionate amount of its business at a specific location. That concentration is not random. Markets don't generate unusual volume by accident. Where you find a cluster of high-volume candles, you find evidence of institutional participation.
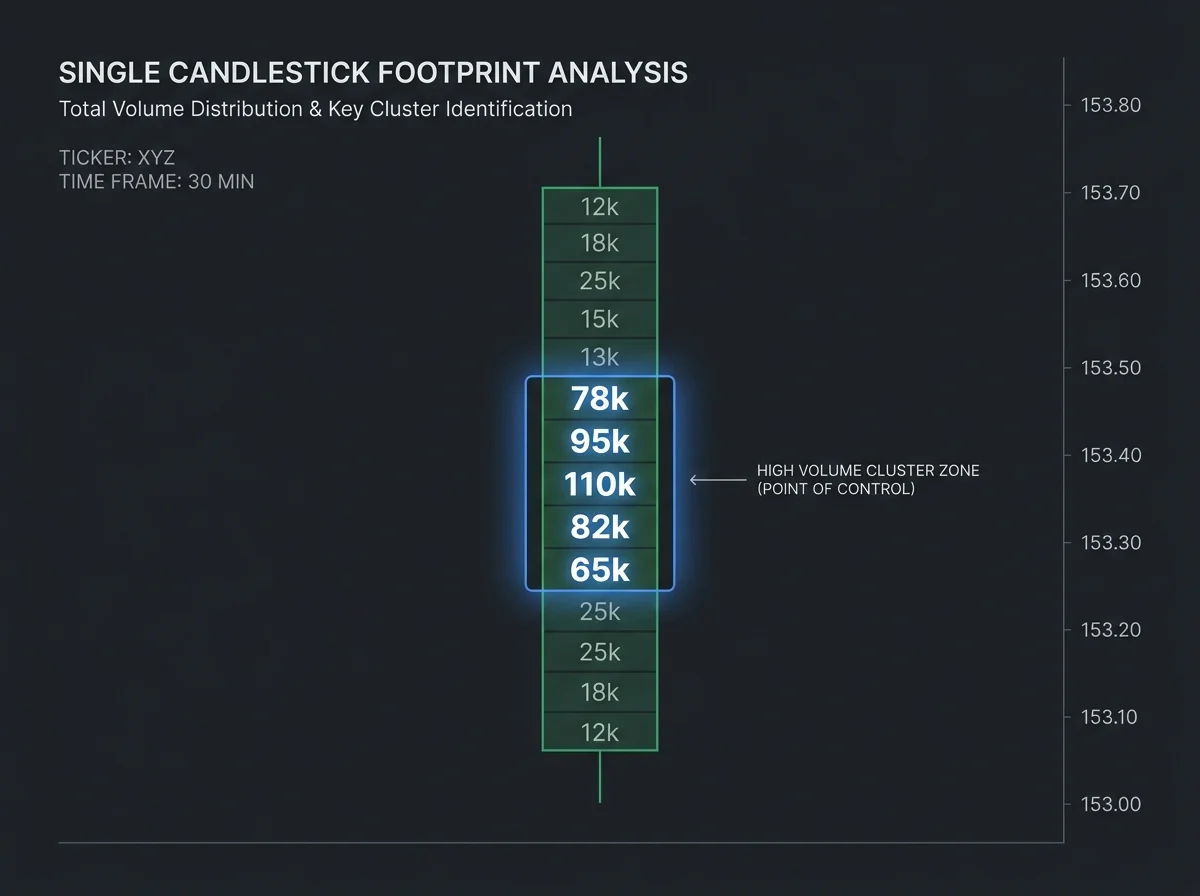
The distinction from other Order Flow patterns like high-volume nodes (which focus on the single row of maximum volume within one candle) or absorption (which focuses on bid/ask imbalances) is important. A volume cluster is measured across multiple candles and uses only total volume, making it one of the more accessible Order Flow concepts — and one of the few that translates directly to forex trading without modification.
Total Volume vs. Bid/Ask Split: Why It Matters
Most Order Flow analysis tools require precise bid/ask data: the exact split of how much volume traded on each side of the market at each price level. This data is reliable in futures markets but largely unavailable in spot forex, where the decentralized nature of the market makes per-side volume impossible to measure accurately.
Volume clusters sidestep this limitation entirely. They are identified using total volume only — the combined activity at each price level, regardless of which side it landed on. This is data that even basic footprint and volume chart platforms make available, including those used in forex trading.
The implication for forex traders is significant: volume clusters give you genuine institutional footprint data that you can actually read in the forex market. You are not working with approximations based on price behavior — you are looking at where the most transactions occurred, which directly reflects where the largest participants were most active.
Why Volume Clusters Reveal Institutional Zones
Institutions cannot hide their activity when operating at scale. A retail trader placing a two-lot position leaves no meaningful trace on a volume chart. An institution accumulating 50,000 contracts over multiple candles at a specific price zone creates an obvious concentration that shows up clearly in the volume data.
The logic behind this is straightforward: when an institution wants to build a large position, they cannot execute it all in one moment without moving the market against themselves. They spread their execution across time — sometimes across multiple candles and sessions — while working to stay within a price range that serves their strategy. The result is a cluster of higher-than-normal volume candles at a relatively tight price zone.
Once the institution has finished building their position, they have a vested interest in defending the price zone where they accumulated. If the market returns to that zone, they are likely to defend it — whether through adding to their position, placing limit orders to absorb selling, or simply having enough existing position size that their activity at the level becomes visible again. This defense tends to make the cluster zone act as support or resistance on subsequent visits.
How to Identify Volume Clusters on Your Chart
Most Order Flow platforms offer automatic volume cluster detection, highlighting candles or zones that exceed a volume threshold in a distinct color (often amber or yellow). If your platform includes this feature, use it — it removes the manual scanning burden during live sessions.
If you're identifying them manually, the process is visual:
- Look at the volume numbers displayed per candle (or the volume bars below your chart, if using volume bars rather than footprints)
- Compare candles within a session or over recent history to develop a baseline sense of "normal" volume for your market
- Identify where two or more consecutive candles show total volume significantly above that baseline — typically 2x to 3x the session average or more
- Note the price range covered by those high-volume candles — this is your cluster zone
The cluster zone is not a single price level but a price range — defined by the highest price touched during the high-volume candles to the lowest price touched. Mark this range with a rectangle on your chart.
The Signal Gets Stronger as the Cluster Grows
Not all volume clusters carry the same weight. Several factors determine how significant a specific cluster is likely to be:
Duration: A cluster spanning 3-4 candles is useful. A cluster spanning 6-8 candles is substantially stronger. More candles at elevated volume means more sustained institutional participation, which translates to a more committed position and a stronger tendency to defend the zone.
Volume magnitude: A cluster where candles show 2x normal volume is meaningful. One where candles show 4x or 5x normal volume is exceptional. The larger the deviation from baseline, the more meaningful the concentration.
Price range tightness: A cluster where all the high-volume candles trade within a 10-pip range is stronger than one spread across 40 pips. Tighter clusters indicate more focused accumulation, suggesting the institution had a more specific target price rather than broad opportunistic buying.
Context within the chart: A cluster that forms at a level that already has significance — a prior swing high or low, a key VWAP level, a volume profile inflection — carries more weight than one that forms mid-range without structural context.
Step-by-Step: Trading the Volume Cluster Pullback
The volume cluster pullback setup follows the same general principle as the HVN pullback — but uses total volume across multiple candles rather than bid/ask data from individual price rows.
Step 1: Establish Trend Context
Volume cluster pullbacks work best in trending markets. Identify whether the dominant market direction is up or down before looking for clusters to trade from.
Step 2: Identify a Cluster That Formed During the Trend
Look for a concentration of high-volume candles that occurred during the trending move. A cluster that formed while price was moving upward is a bullish accumulation zone. One that formed while price was moving downward is a bearish distribution zone.
Step 3: Mark the Cluster Zone
Draw a rectangle on your chart covering the full price range of the high-volume candles. Include a small buffer above and below to account for normal variation. This zone is your potential pullback entry area.
Step 4: Wait for Price to Pull Back Into the Zone
After the cluster forms, wait for price to retrace back toward it. In an uptrend, this means waiting for a downward pullback that returns price to the cluster zone. In a downtrend, wait for an upward pullback that re-enters the zone.
Patience is required. Sometimes the pullback arrives within the same session. Other times it takes several sessions before price retraces to the cluster level.
Step 5: Enter in the Direction of the Trend
When price enters the cluster zone, enter in the direction of the trend:
- Cluster formed in uptrend + price pulling back into zone → Long entry
- Cluster formed in downtrend + price pulling back into zone → Short entry
| Cluster Type | Trend Direction | Pullback Entry |
|---|---|---|
| High-volume uptrend candles | Bullish | Long when price returns to zone |
| High-volume downtrend candles | Bearish | Short when price returns to zone |
Place your stop loss beyond the cluster zone (below for longs, above for shorts). Target the next structural resistance or support level in the trend direction.
Does This Work on Forex?
Yes — and this is one of the most practical advantages of volume cluster analysis compared to other Order Flow techniques.
Because volume clusters use total volume only, they require no bid/ask precision. Forex platforms that display tick volume (a proxy for real volume) provide sufficient data to identify clusters. The interpretation is the same: abnormally high tick volume concentration in a narrow price zone indicates where the most significant market participation occurred.
The practical difference from futures is that tick volume in forex is a less precise proxy than actual trade volume in futures. A concentration of 50,000 ticks in a forex volume cluster is meaningful, but you cannot be certain that each tick represents a specific contract size. Treat forex volume clusters as directionally reliable but not perfectly precise — which is still considerably more information than a standard candlestick chart provides.
For this reason, volume cluster analysis is often recommended as an entry point for forex traders who want to incorporate Order Flow concepts before committing to the more advanced bid/ask analysis that requires futures-quality data.
Best Time Frames for Volume Cluster Trading
Volume clusters are visible across all time frames, but the practical utility varies:
5-minute chart: Good for identifying intraday clusters during high-liquidity sessions. Requires faster reaction times when the pullback enters the zone.
30-minute chart: The most balanced option. Clusters are clearly defined, pullbacks take time to develop, and entries have enough time to be evaluated properly before price moves through the zone.
1-hour chart: Suitable for swing-oriented trading. Fewer setups but each represents more sustained institutional activity and typically offers larger profit targets.
Daily chart: Can be used to identify longer-term volume concentration zones that influence price over days or weeks, though requires longer holding times.
For most active traders, the 30-minute chart provides the best combination of clarity, frequency, and practical tradability.
Common Mistakes to Avoid
Defining the cluster too loosely. Including candles that are only marginally above average volume dilutes the signal. A cluster should represent genuinely abnormal volume — candles that clearly stand out from their neighbors.
Trading against the trend direction. Volume clusters are pullback entry zones in the direction of the trend, not reversal signals. A cluster that formed during a downtrend should be used for short entries, not for speculating that price will reverse upward from it.
Entering before price reaches the zone. Patience is the defining skill of this setup. Entering early — before price actually retraces to the cluster zone — removes the statistical edge. Wait for price to enter the zone.
Using the strategy in choppy, trendless markets. Clusters in sideways markets produce noise, not clean pullback entries. Reserve the strategy for clear trending conditions where the cluster has directional context.
Treating every cluster as equally important. Size, duration, tightness, and contextual placement all matter. Develop a filtering instinct for which clusters represent the strongest institutional concentration and prioritize those.
Final Thoughts
Volume clusters bring the discipline of Order Flow analysis into a format that is accessible to anyone with a basic volume chart — including forex traders who lack access to precise bid/ask data. The concept is grounded in market microstructure reality: unusual concentrations of volume reflect genuine institutional participation, and institutions tend to defend the zones where they built positions.
The pullback setup built on volume clusters is one of the most practical applications of this concept. By identifying where institutions accumulated, marking that zone, and waiting patiently for price to retrace into it, you position yourself alongside some of the largest and most informed participants in the market — entering from a level they care about and have motivation to defend.
As with all Order Flow techniques, effectiveness compounds with experience. Study historical clusters, trace where pullbacks developed, observe how the zones held (or broke), and build pattern recognition through deliberate practice. Over time, volume clusters become some of the most intuitive and actionable reference points on your charts.
FAQ
What is an order flow volume cluster?
A group of consecutive footprint candles with significantly higher-than-normal total volume, concentrated within a narrow price range. It indicates sustained institutional participation at a specific price zone.
How do volume clusters differ from high-volume nodes?
High-volume nodes identify the single price row with the most volume within one candle. Volume clusters identify zones where multiple consecutive candles all showed abnormally high total volume — a broader measure across time rather than within a single candle.
Does volume cluster trading work on forex?
Yes. Because it uses total volume rather than bid/ask splits, it works with tick volume data available in forex platforms. The signal is less precise than in futures but still directionally reliable.
What is the minimum number of candles needed to form a valid cluster?
Two candles with abnormally high volume can form a valid cluster, but three or more candles in a tight price range is considerably stronger and more reliable.
How do I set the take profit for a volume cluster pullback trade?
Target the next significant structural level in the trend direction — a prior swing high for long trades, a prior swing low for short trades. Alternatively, look for the next volume cluster or HVN zone as a natural exit point.
Do I need special software to see volume clusters?
Basic volume histogram data (available on most charting platforms) is sufficient for visual identification. Some Order Flow platforms offer automatic highlighting. Either approach works.
Disclaimer: Educational content for traders. Not financial advice, not a signal service, and no outcome is guaranteed. Test every rule yourself before risking capital.
Comments (0)
Comments are moderated. Your comment will appear after it's approved.
Comments are moderated. Your comment will appear after it's approved.
Loading comments…