
Retail charts only show where price has been. Liquidity Heatmaps (such as Bookmap or institutional DOM software) reveal where resting limit orders are waiting. Liquidity is the essential fuel driving every market movement.
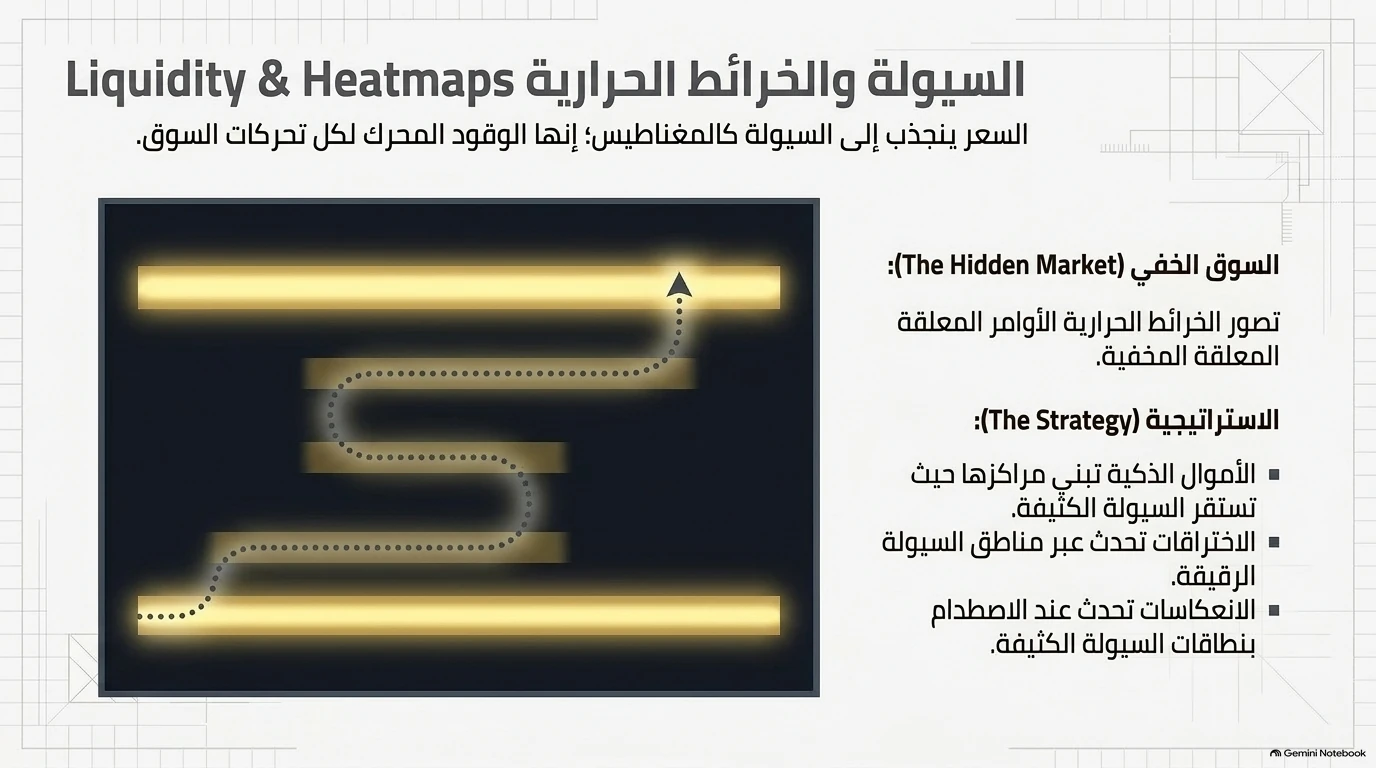
1. Price Attracts to Liquidity Like a Magnet#
Large institutions cannot execute multi-million dollar positions with a single market order without causing disastrous slippage. Instead, they require resting liquidity pools to fill their orders: * Price naturally gravitates toward large concentrations of resting limit orders. * These liquidity pools serve as the counterparty needed for institutional accumulation or distribution.
The Hidden Market (السوق الخفي): Heatmaps visualize resting limit orders residing in the Depth of Market (DOM) over time, turning the invisible order book into a readable visual landscape.
2. Institutional Heatmap Strategy#
- Smart Money Positioning: Institutional algorithms place large bids and offers where dense resting liquidity sits.
- Breakouts Slice Through Voids: When the order book is thin (few resting limit orders), even modest aggressive market volume can move price across several ticks almost instantaneously. Breakouts accelerate across thin liquidity zones.
- Reversals Collide with Walls: When a fast-moving price slams into a thick, persistent liquidity band that refuses to pull back or cancel, the move is abruptly absorbed, leading to sharp reversals.
3. Spoofing vs. Real Liquidity#
Not all visible liquidity is genuine: * Spoofing (Fake Liquidity): Algorithms flash massive limit orders to intimidate retail traders into market-selling or market-buying, only to cancel them milliseconds before price arrives. * Committed Liquidity: High-density bands that remain steady as price approaches and actually trade thousands of contracts when price connects.
4. Integrating Heatmaps with Order Flow#
- Use Heatmaps to identify Target Liquidity Zones and major resting obstacles.
- Once price connects with the heatmap level, switch to the Footprint Chart to verify whether the level is absorbing the flow or breaking through.
Learn how to connect liquidity zones with Volume Profile HVNs and LVNs and apply The CZT Setup Framework.
Return to the Order Flow Pillar Guide.