Not financial advice. Analyses on this site reflect personal opinion for informational and educational purposes only. You are responsible for your own decisions. (Disclaimer version 1.0)

→ Index

Interpretive research — not financial advice

Market Structure: Balance → Breakout → Retest

This is the theoretical foundation the execution setups in the other three pages are built on. Price moves between balance areas (dense execution clusters) and breakouts (price explosions out of them). Understanding how and why these areas form explains why the "retest" opportunity keeps recurring.

The core auction idea

Picture the market as an auction room full of participants: some want to buy and some want to sell. Price moves exactly as it changes in any open auction — if there is large demand (a lot of buying) price rises, and if there is large supply (a lot of selling) price falls. This is "market balance theory" at its core.

Step 1Intro slide: trading through an understanding of auctions
A simplified definition: the market is a room full of buyers and sellers, and price is the instantaneous result of the balance between demand and supply — exactly as price changes in any open auction according to the volume of bidders on each side.

Why large players hide their order size

Large players (hedge funds, sovereign wealth funds, institutional trading desks) cannot execute a huge trade in a single click — because that would move price against them instantly before they finish executing. So they split the trade and hide it.

Step 2A hypothetical example of an institutional trader wanting to execute a huge trade
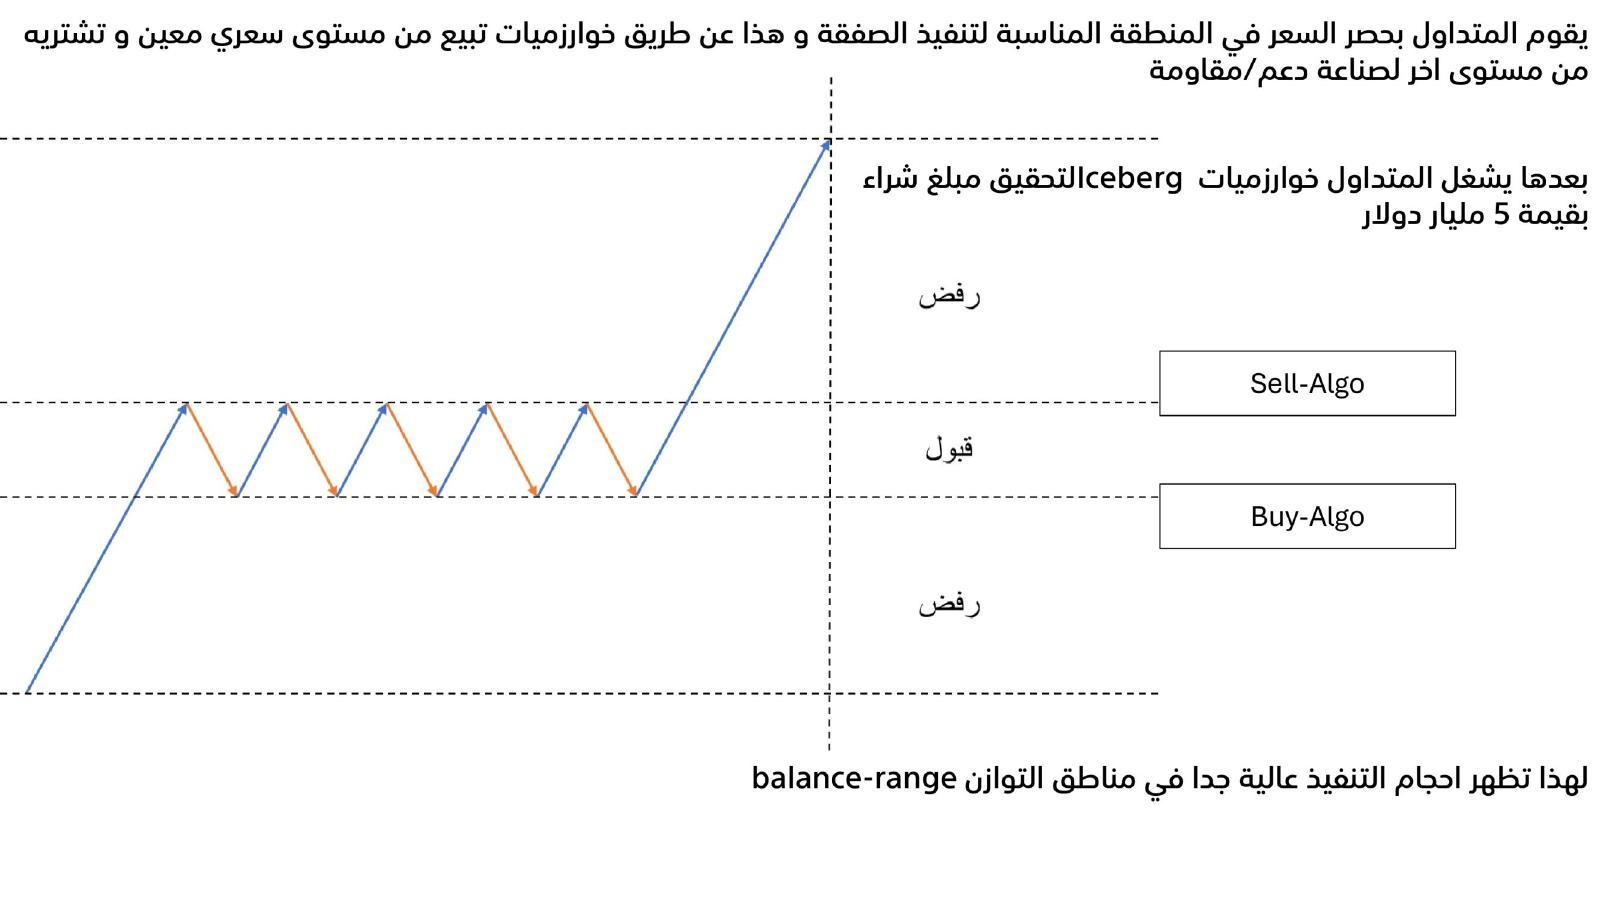
An illustrative example: a professional trader at an institutional desk receives a request from a client (a large investment fund) to execute a huge buy worth 5 billion dollars. Any trade of this size could move prices if executed all at once, so the team begins by assessing available liquidity and measuring the potential "market impact" before executing.
Step 3An illustration of executing a trade via Iceberg algorithms within a confined price range
The solution: confining the trade's execution inside a narrow price range instead of a single strike, via execution algorithms (known as "Iceberg" algorithms) that automatically sell as price approaches the upper bound and buy as it approaches the lower bound, while movement is freely accepted in the middle zone. This continuous repetition of buying and selling within a narrow range is exactly what produces the "balance areas" with dense execution volume.

How balance areas reveal the traces of their execution

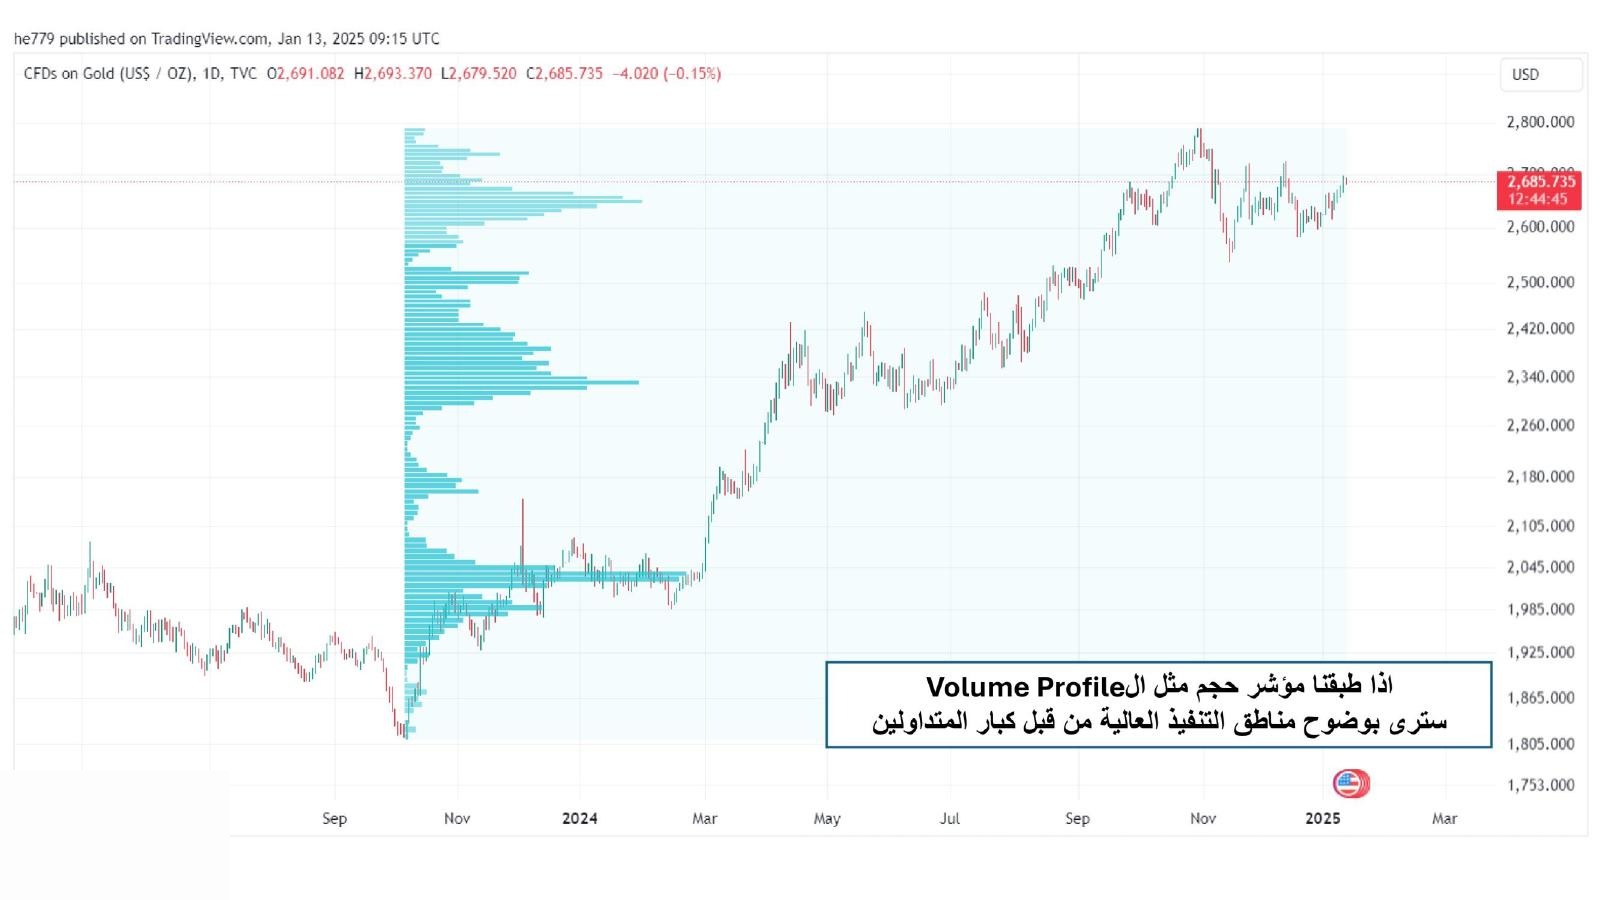
The effect of this hidden execution shows up clearly on the volume indicator (Volume Profile): areas of dense execution clustering appear as long horizontal rows on the profile, while areas price passed through quickly (without significant execution) are short rows.
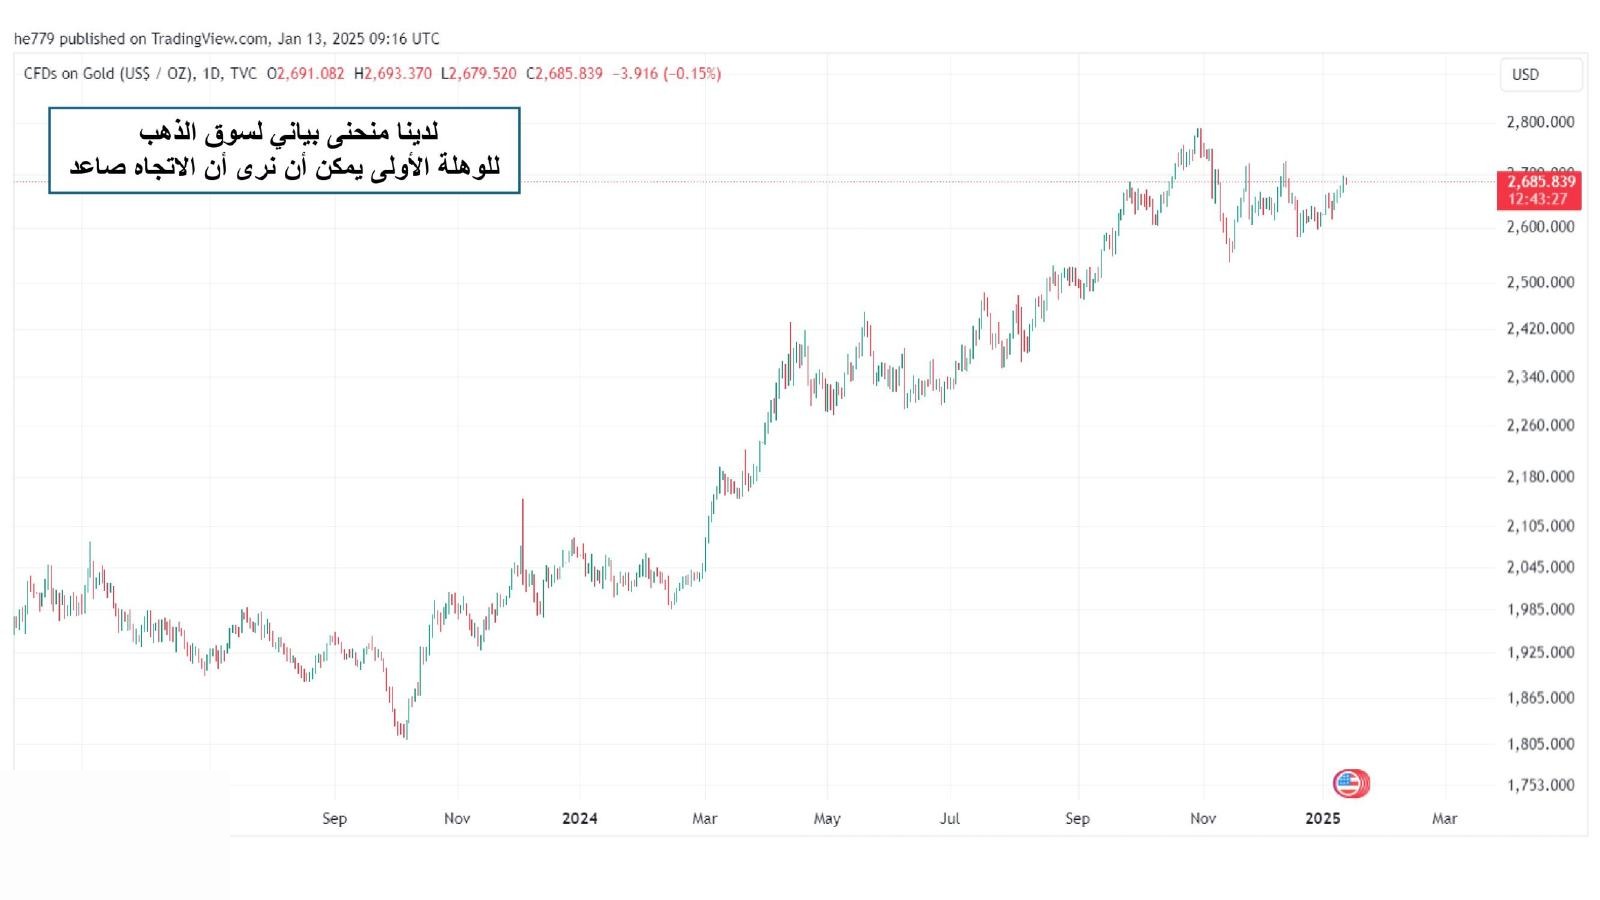
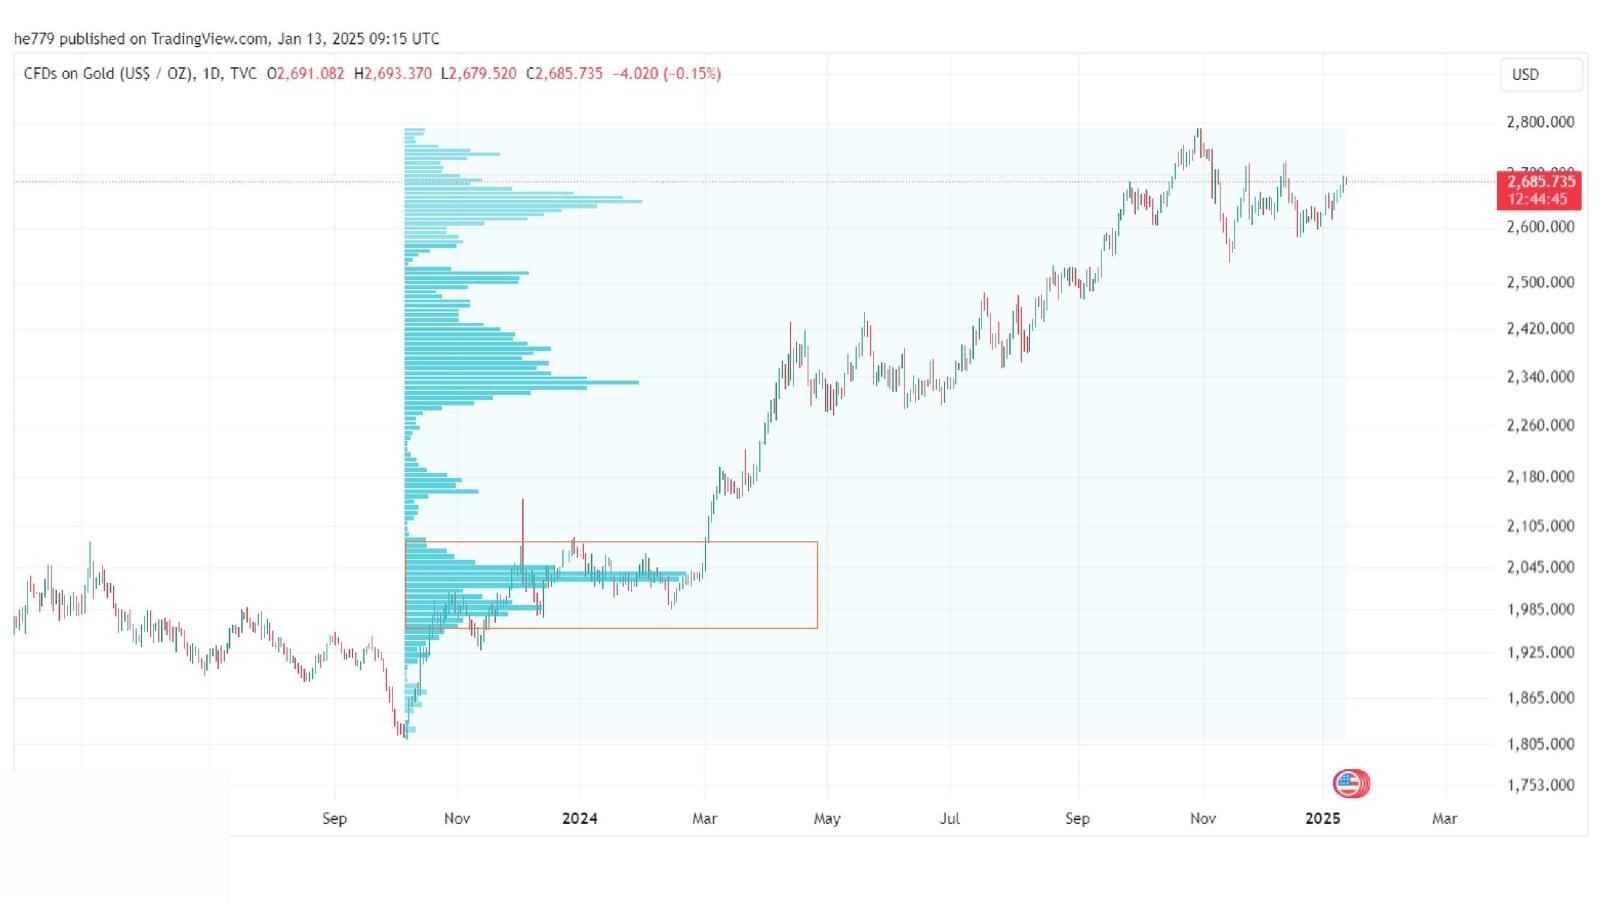
Step 4An actual price chart in an uptrend
A real price chart (daily timeframe) showing a general uptrend — the starting point for applying the idea to real data.
Step 5The same chart with the Volume Profile indicator added
By adding the volume indicator (Volume Profile) to the same chart, the very-high execution areas the large traders left behind immediately become clear — the long horizontal rows on the left of the chart.
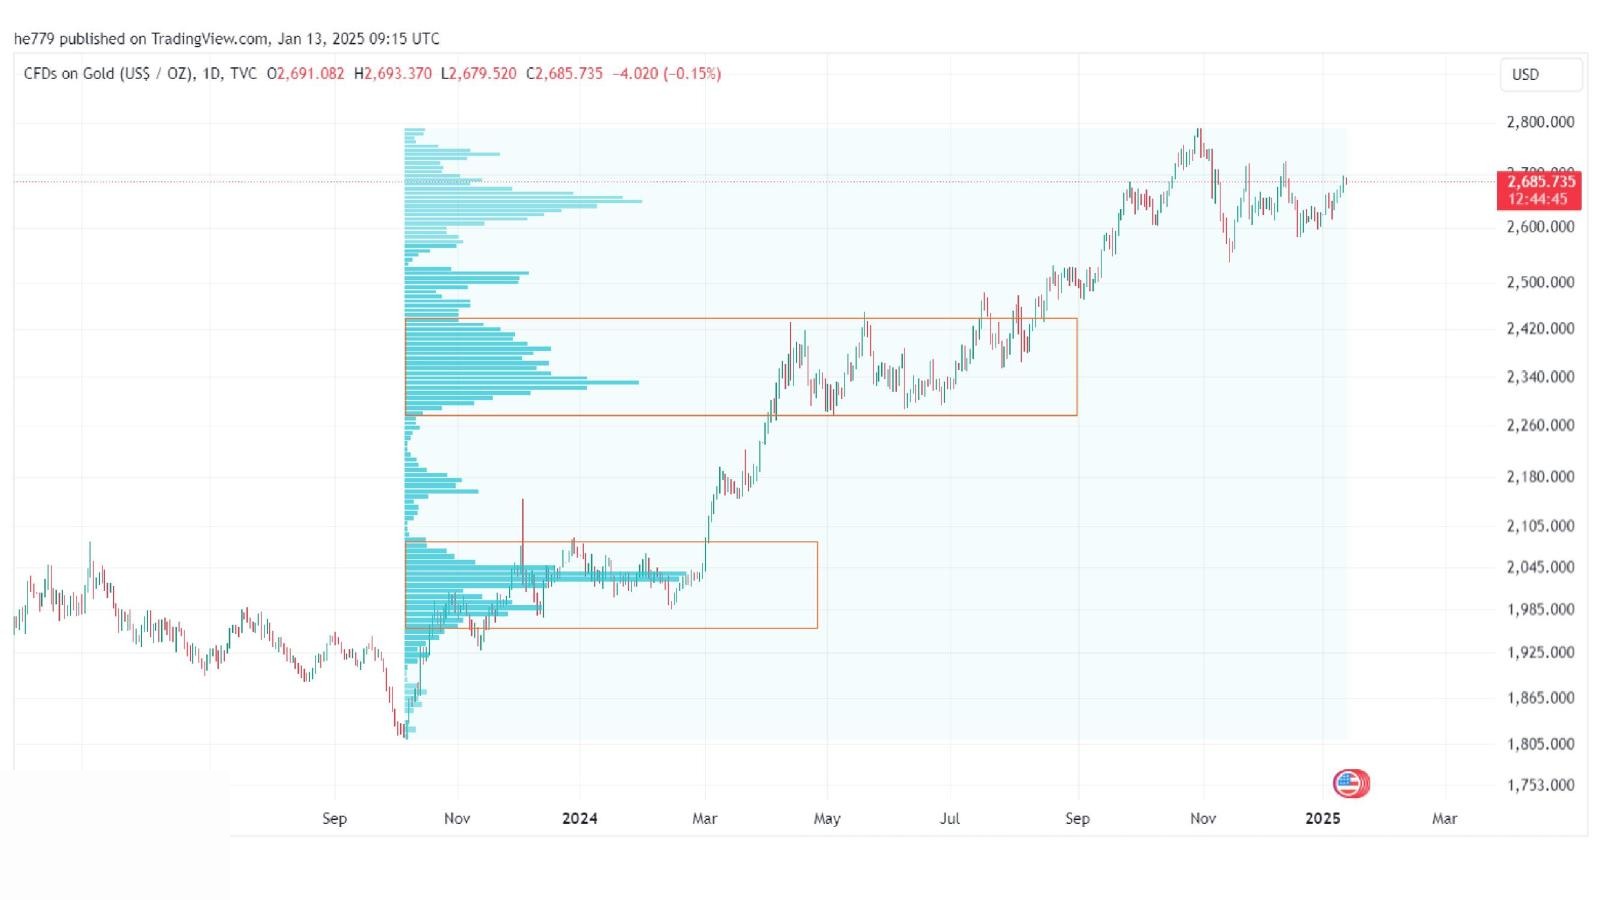
Step 6Identifying the first balance area on the volume indicator
Identifying the first balance area: a specific price range that saw repeated dense execution before price continued rising from it.
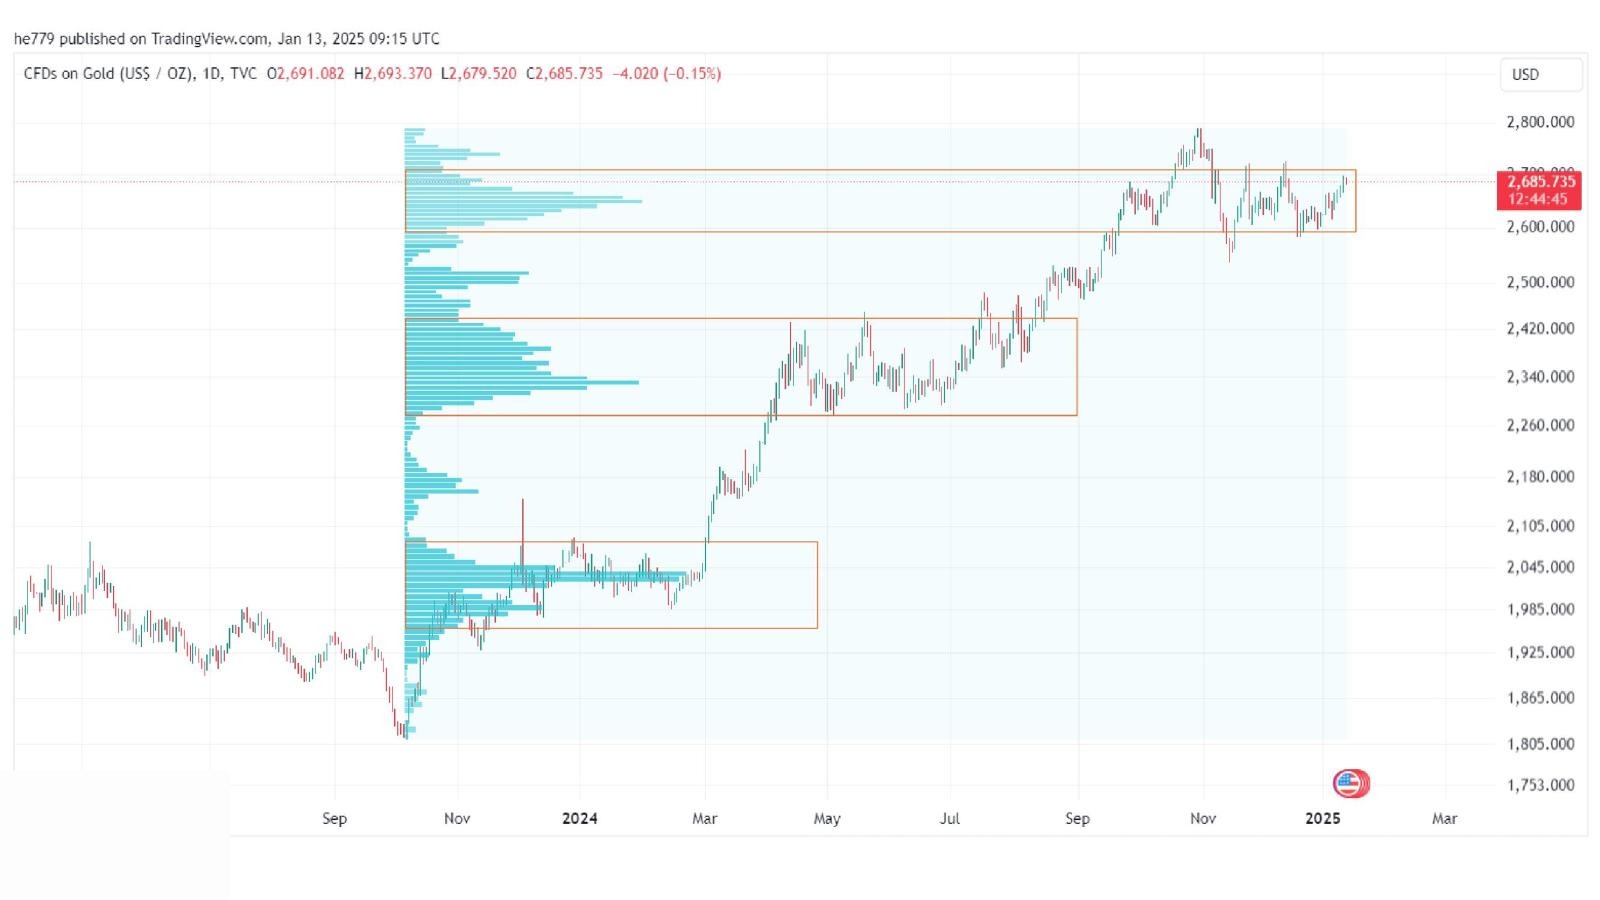
Step 7Identifying a second balance area higher in the same direction
Identifying a second balance area higher after the rise continued — the same pattern repeats: dense execution then continuation of the move.
Step 8Identifying a third balance area as the rising staircase begins to form
Identifying a third balance area: the sequence now begins to form as a "staircase" of ascending balance areas — this is the shape the concept of reading trend will later be built on.

The price explosion reveals their intent

As long as price is inside the balance area, no one knows for certain whether the dense execution was accumulation of buying or accumulation of selling. The moment of decision is the "price explosion" that takes price out of the area — this exit is what reveals the direction of the large players' intent.
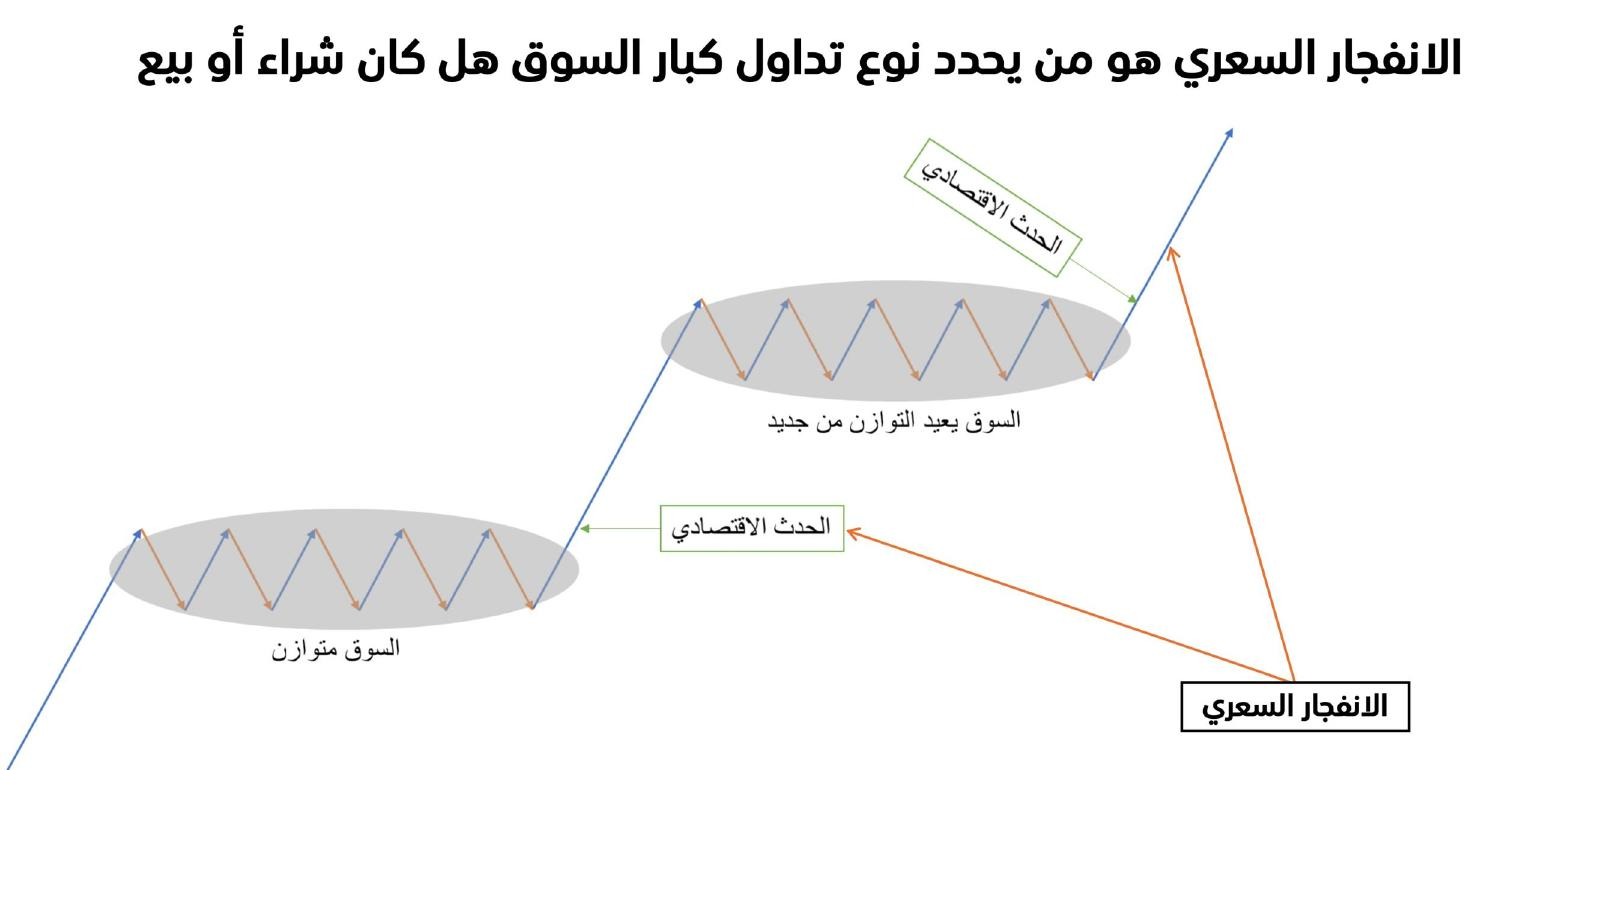
Step 9Diagram: the price explosion determines the type of the large players' trading
The market stays balanced until an event (economic or a sudden order flow) pushes it out of the range with force. The direction of this explosion (up or down) is the actual evidence of what the large players were doing inside the balance area: accumulating buys or accumulating sells. Right after the explosion, price begins forming a new balance area at its new level.

The retest = the opportunity to enter with the large players

After the price explosion, price often returns to retest the edge of the balance area it broke out of before continuing its original move. This moment — price returning for the retest — is the opportunity to enter with the same side that drove the explosion in the first place, because it is usually still defending that level.
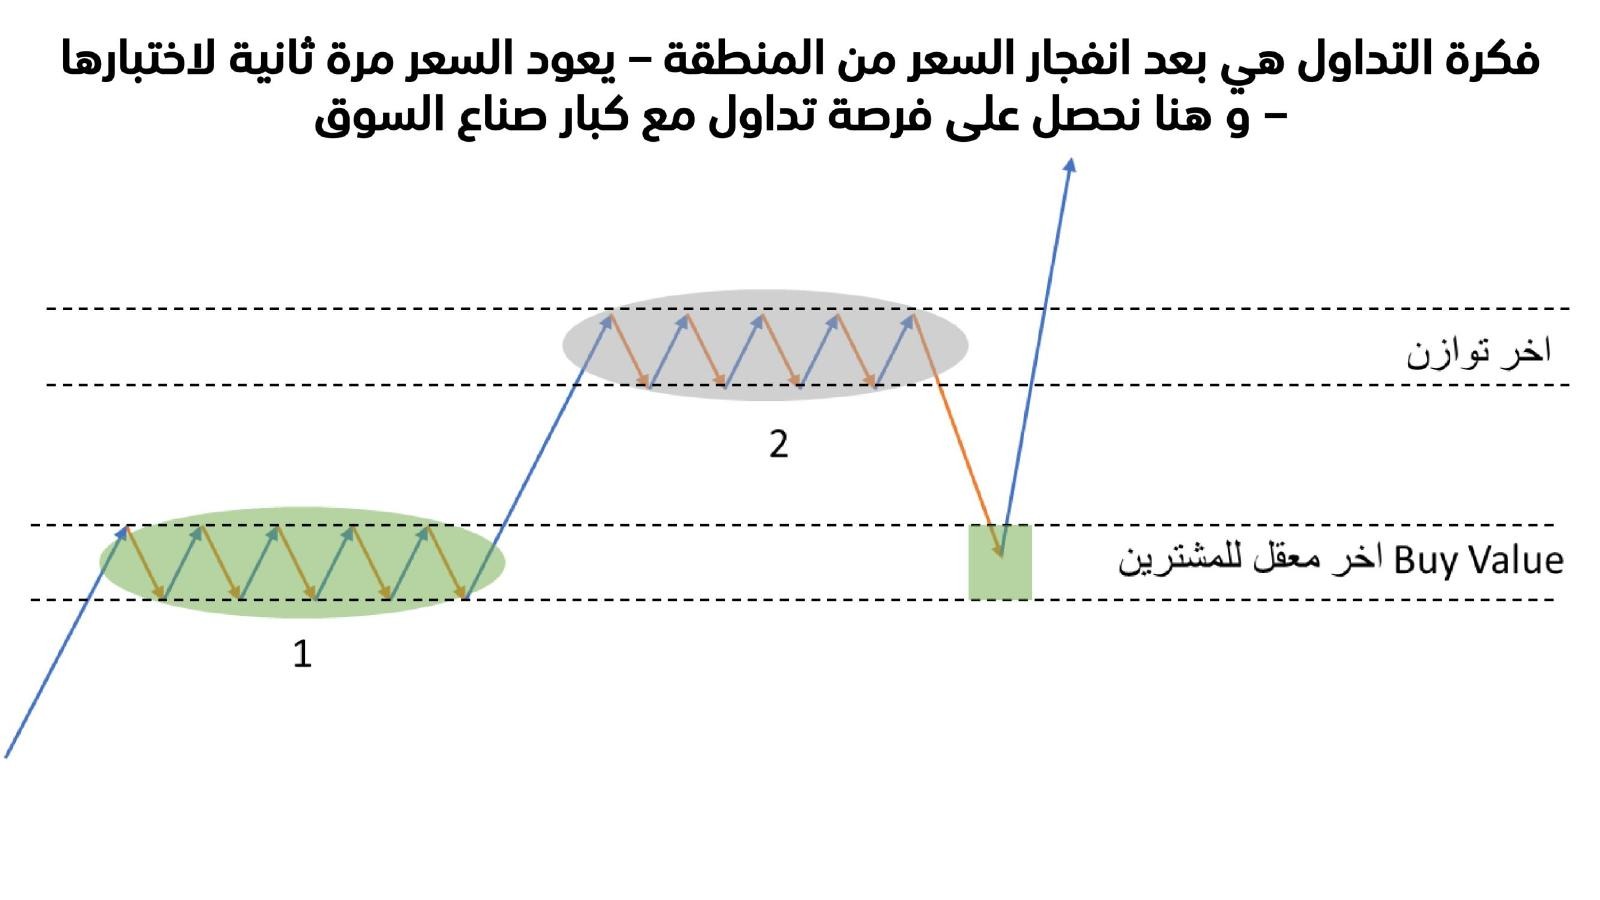
Step 10Diagram: after price explodes out of the area it returns to test it a second time — an opportunity to trade with the large players
After price exits the first balance area (the "last stronghold of the buyers") and forms a second balance area higher, price pulls back down to retest the upper edge of the first area precisely. This return is the trading opportunity: entering a buy from the same area where the large buyers defended the first time.
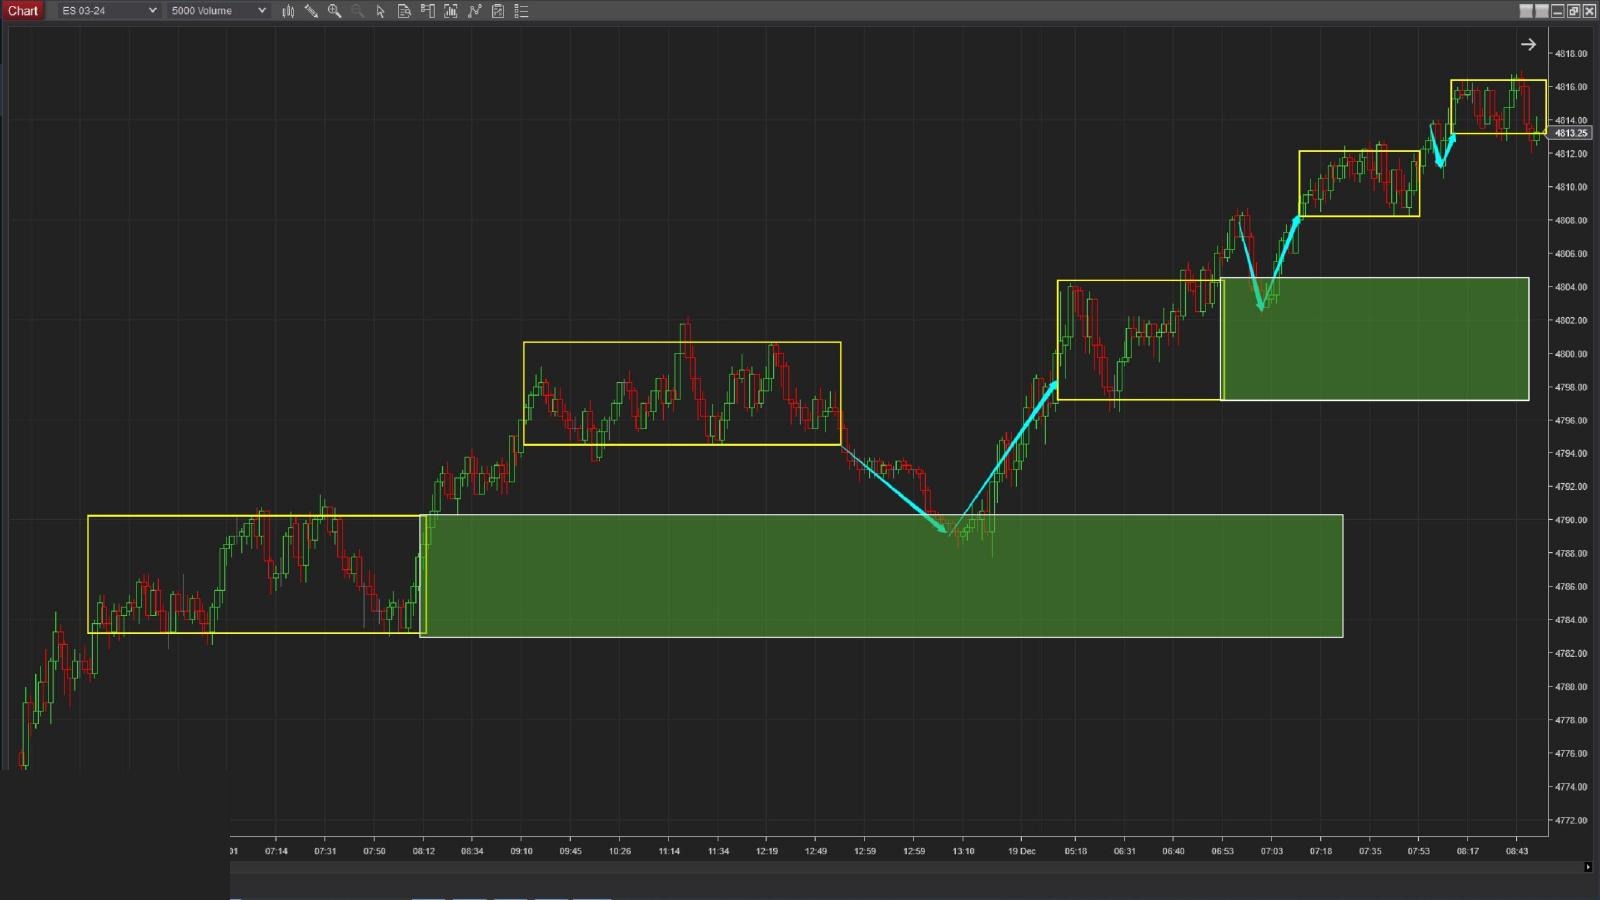
Step 11A real chart example: a series of ascending balance boxes with retest arrows
A real example on a price chart: each yellow box represents a balance area, and the blue arrows show how price pulls back to retest the edge of each area before continuing to the next area — a complete rising staircase built entirely on this recurring pattern.
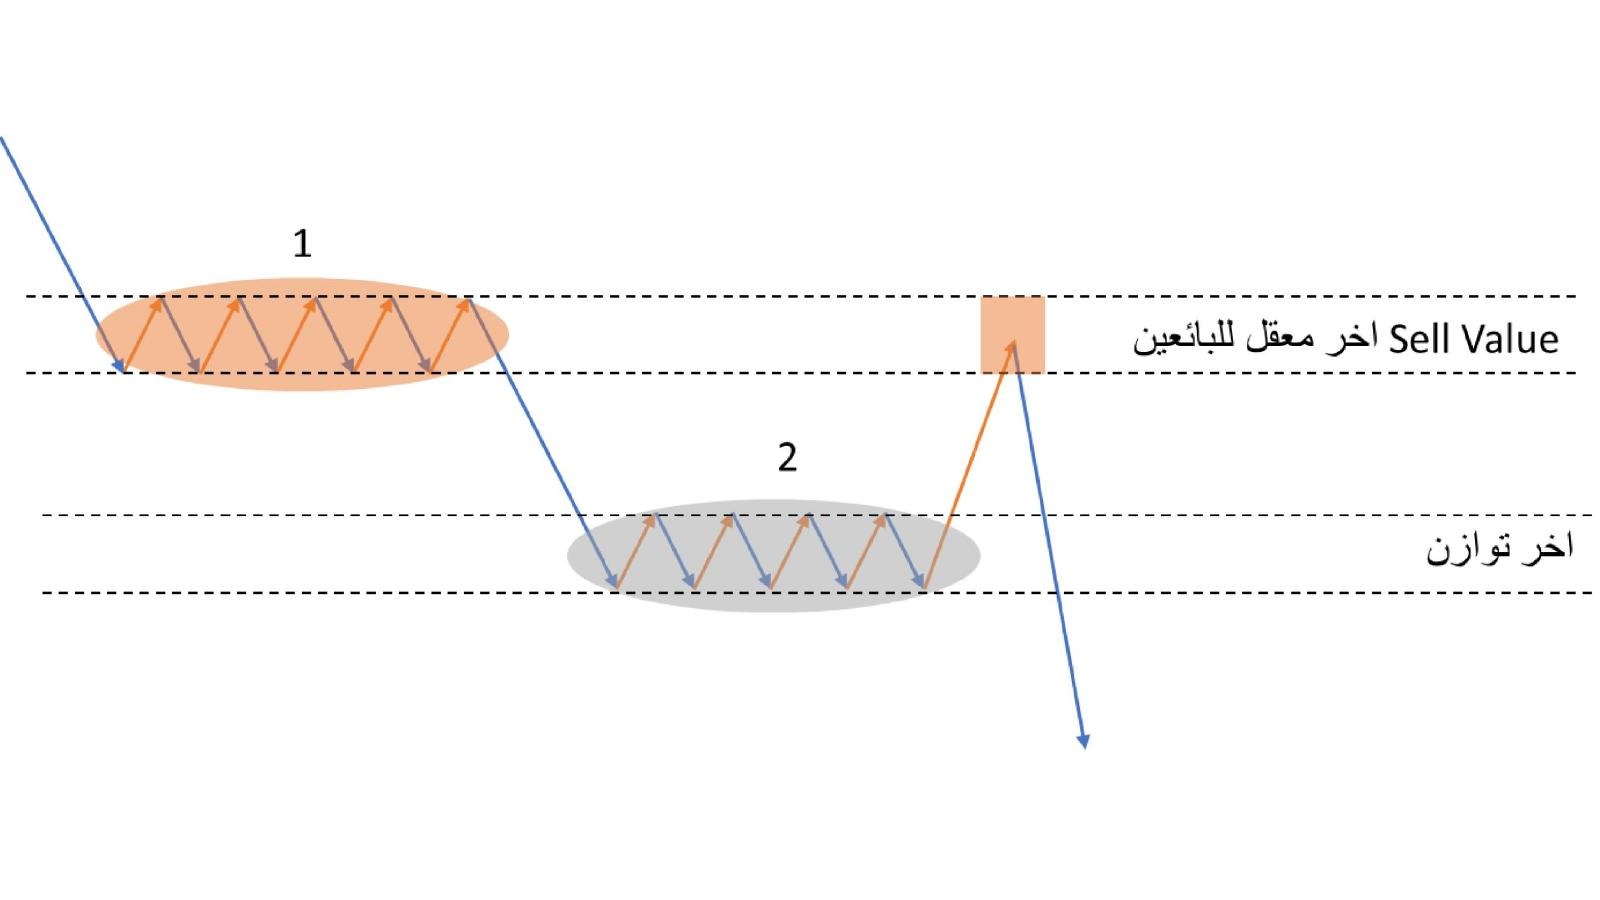
Step 12The same retest idea inverted for a downtrend
Exactly the same idea, inverted for the downside: after price exits the "last stronghold of the sellers" area and forms a lower balance area, it pulls back up to retest the lower edge of the sellers' area before continuing to fall.
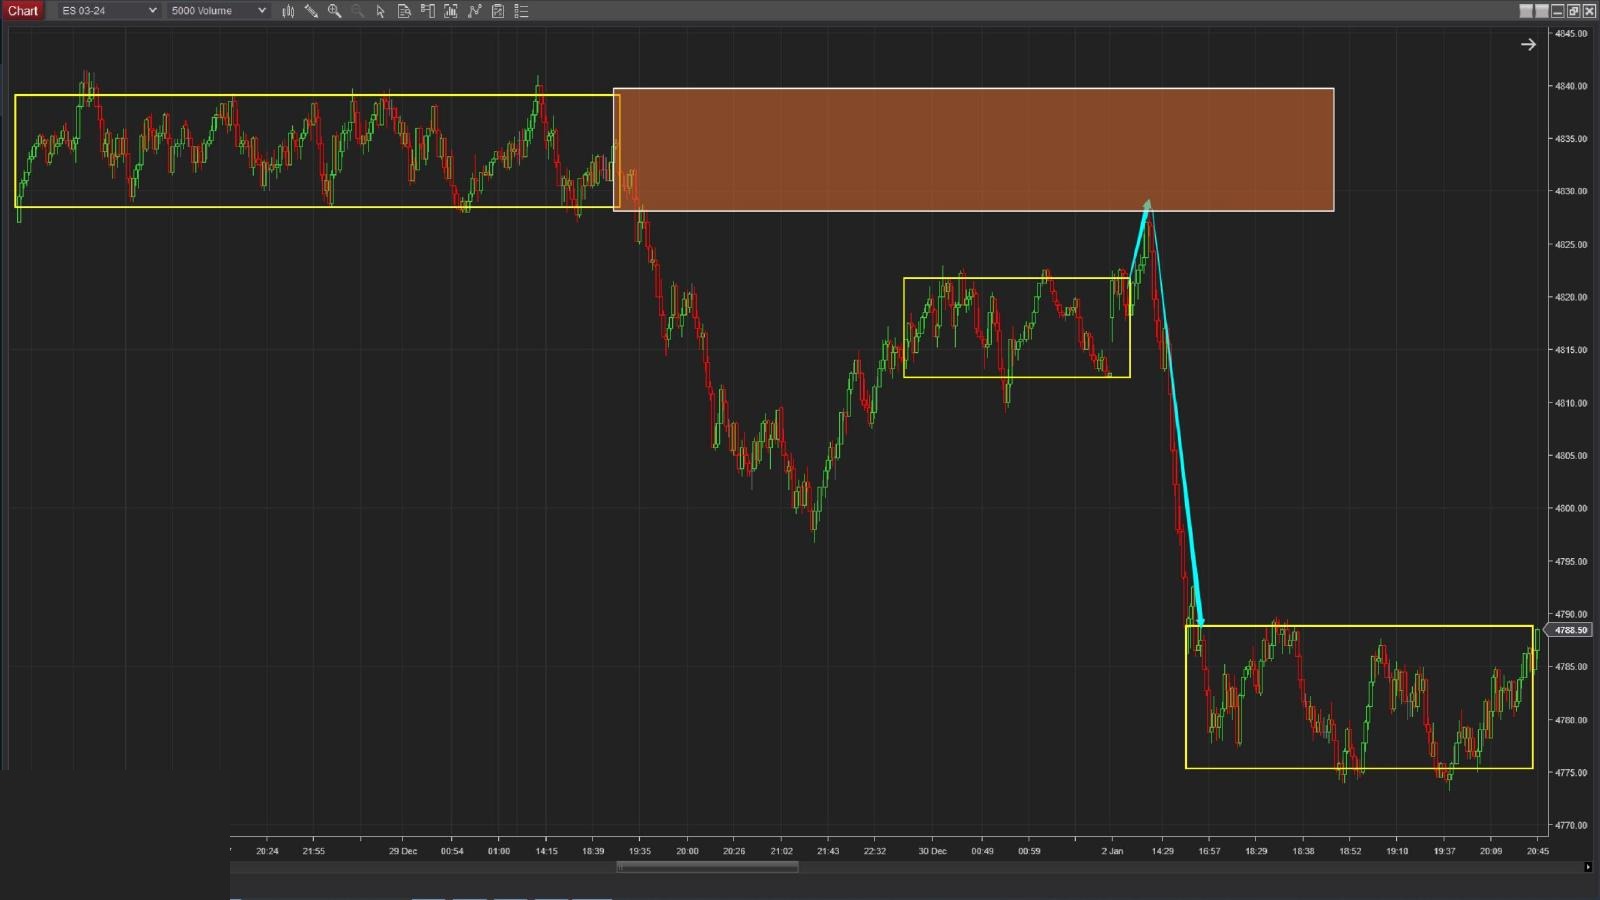
Step 13A real example on a downtrend chart: a large balance area, a sharp downward breakout, then new balances
A real example: a large balance area at the top of the chart, then a sharp downward breakout (the orange rectangle) from which price exited with force, followed by the formation of two new lower balance areas, each recording a small pullback before continuing — the same staircase logic but in a downtrend.

Risk management around the retest area

The retest area itself naturally defines the stop and target — the stop just behind the area, and the target toward the next balance area or further if the move continues.

Step 14Section title: risk management in trading
A section divider: the transition from "where you enter" to "how you manage risk" after entering at the retest area.
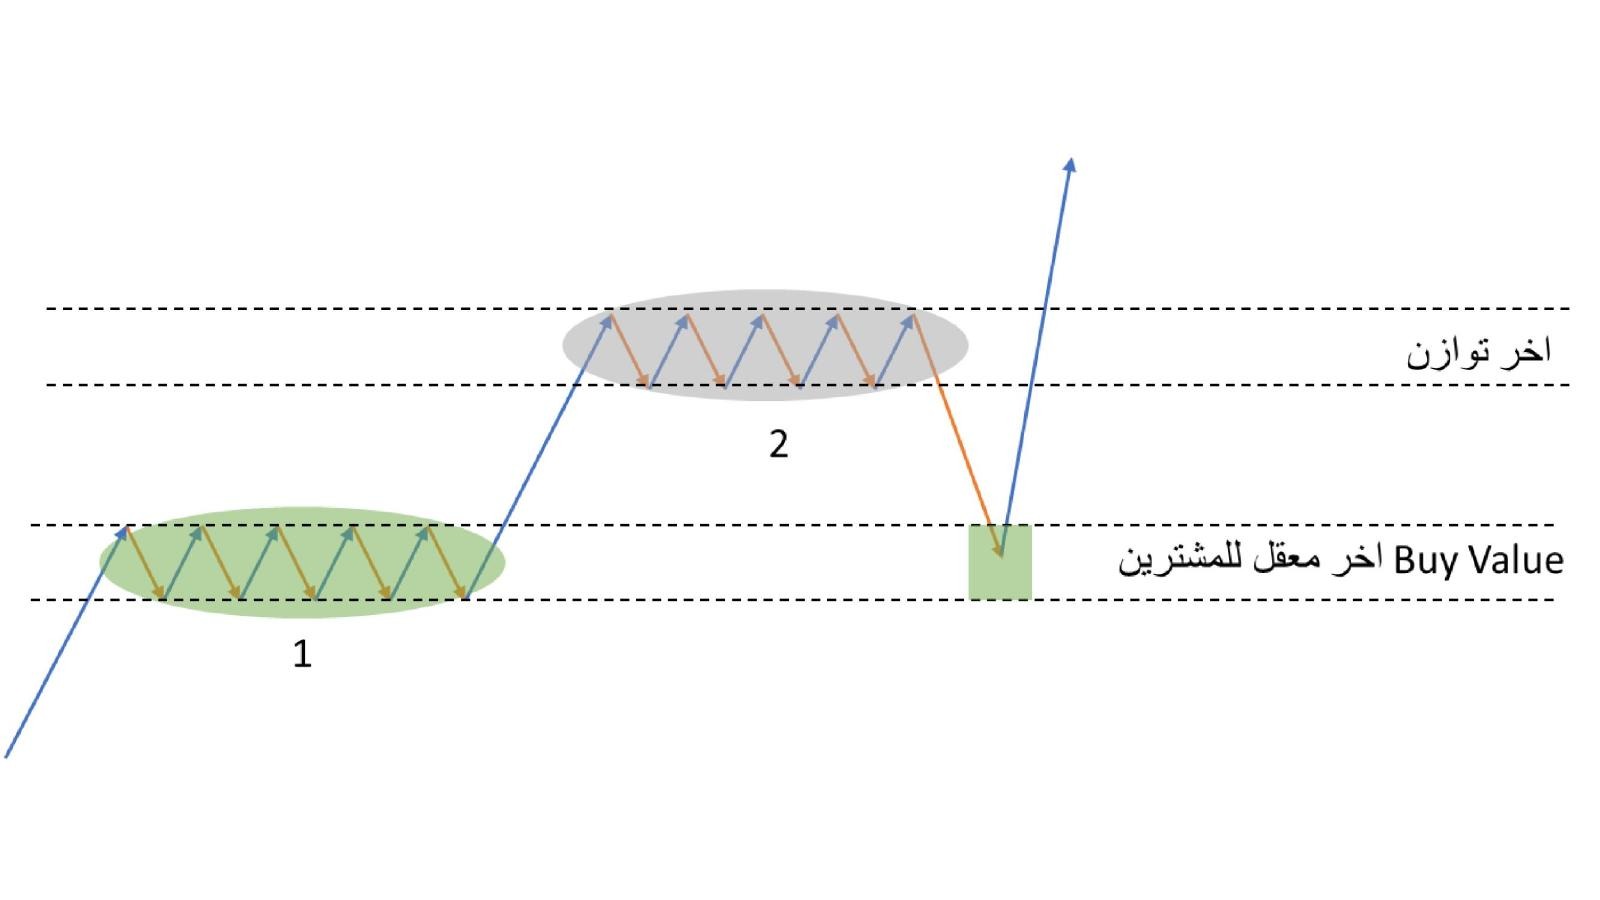
Step 15Re-displaying the bullish retest diagram as the basis for setting stop and target
The same bullish retest diagram is now used as a structural basis for setting the exit levels: the edge where price bounced (the "last stronghold of the buyers" area) is the natural reference for the stop, and the next balance area is the natural reference for the target.
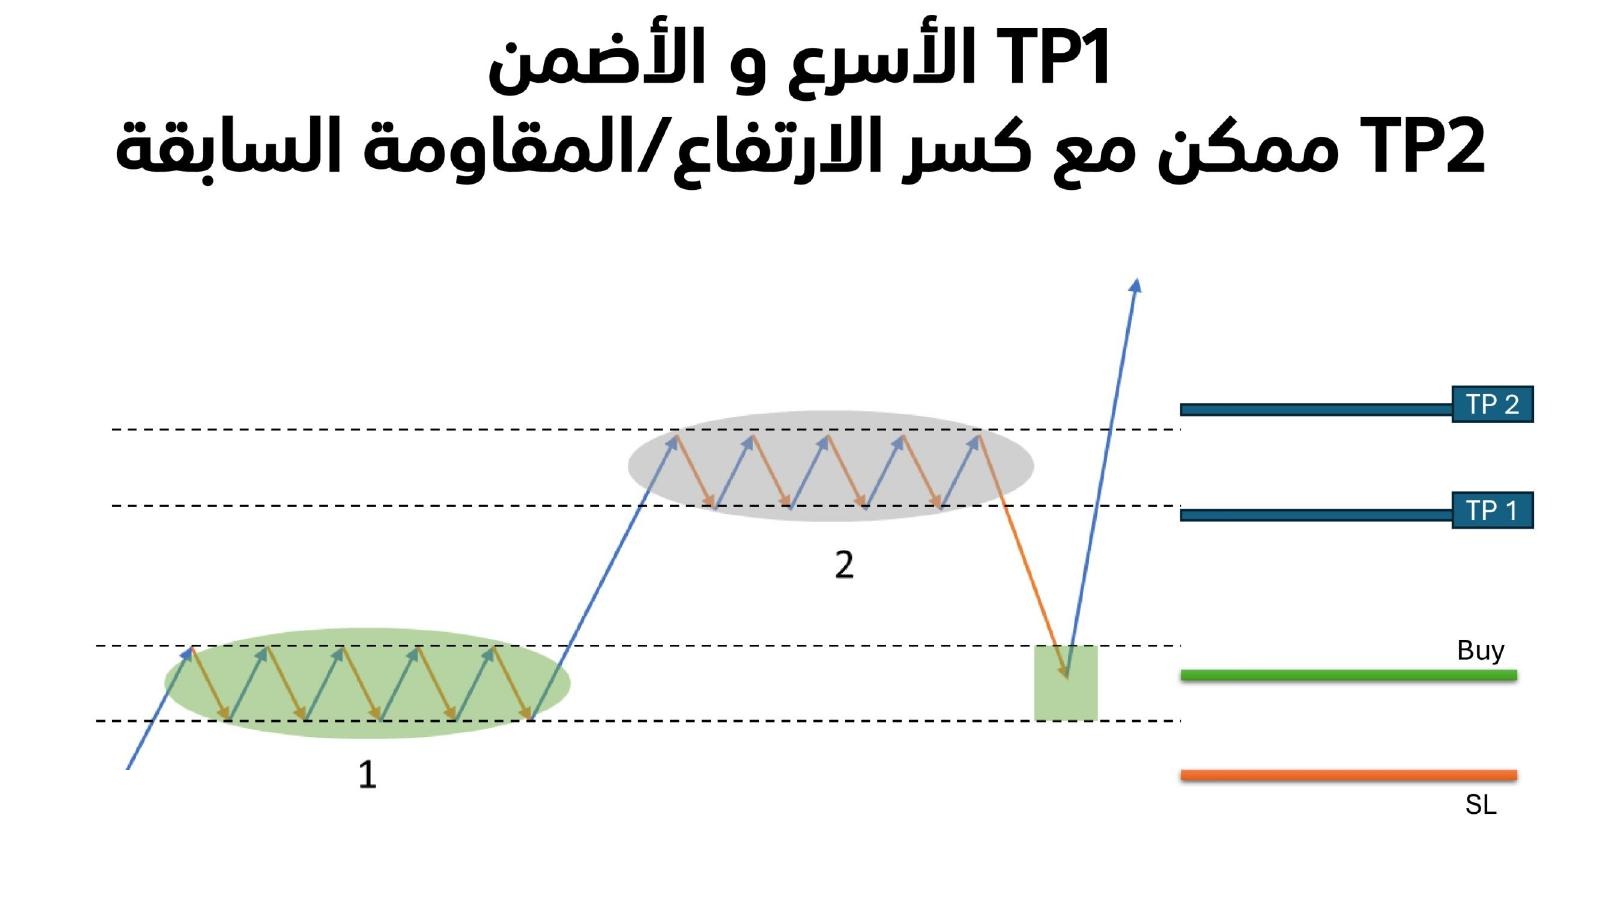
Step 16The same diagram with explicit marking of the TP1, TP2 and SL levels
Explicitly marking the levels: SL just below the retest area. TP1 at the edge of the next balance area — the fastest and safest target. TP2 further out, and becomes viable only if price breaks the previous high/resistance and does not stall at it.
Stop
Just below the retest area
First target (TP1)
Edge of the next balance area — the fastest and safest
Second target (TP2)
Only on breaking the previous high/resistance

Reading the trend as a staircase of balances

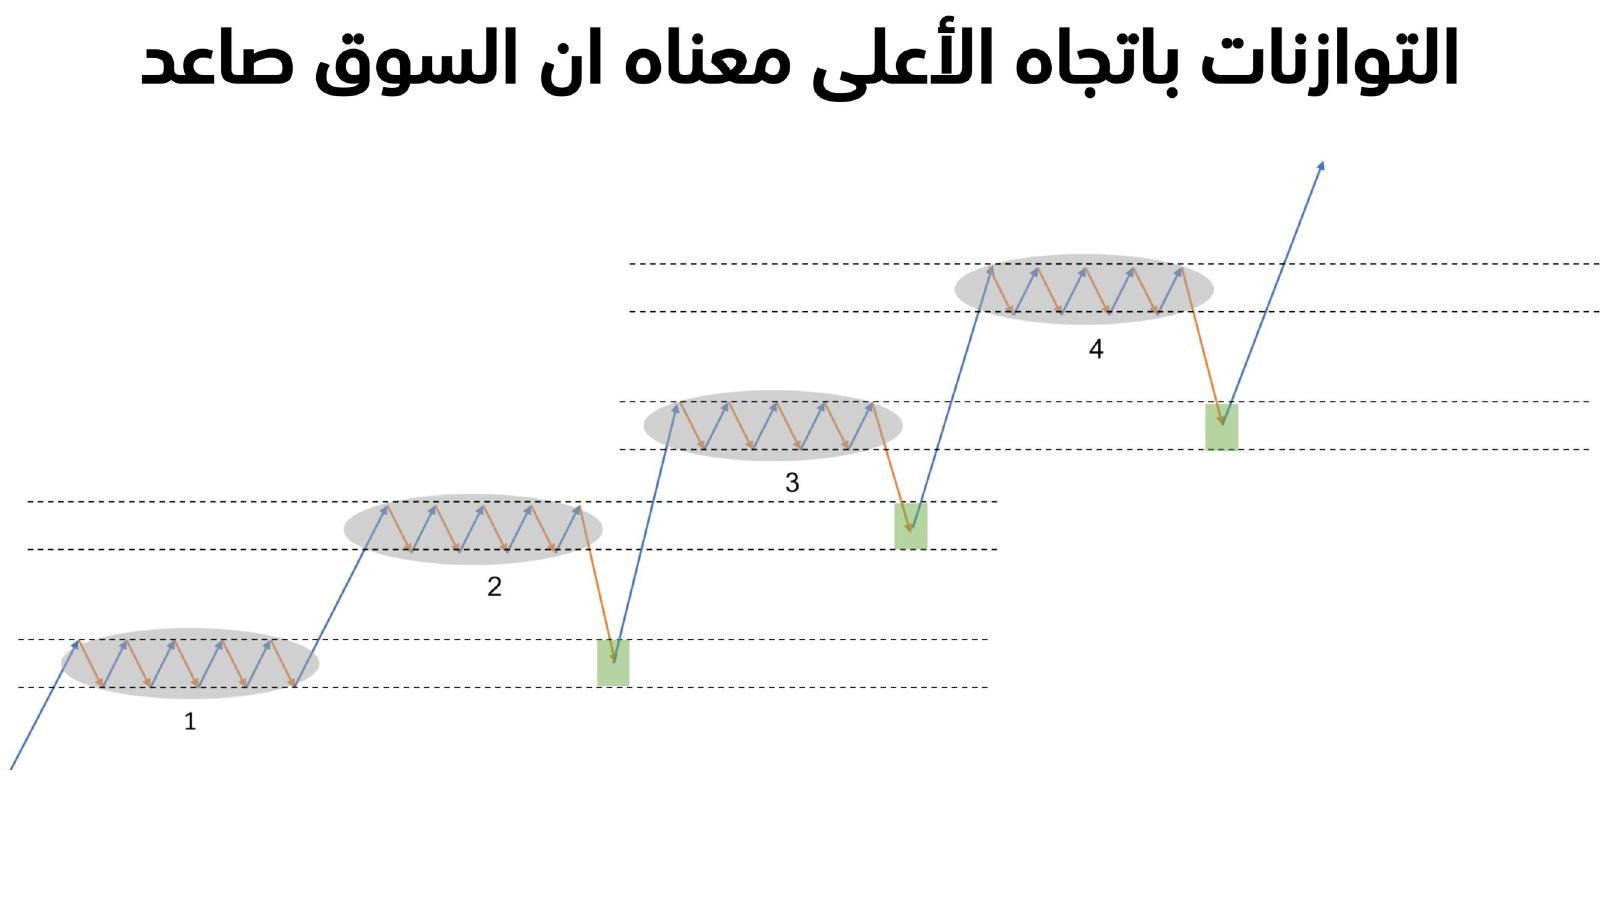
If balance areas repeat in the same direction, that is the definition of trend itself — a rising staircase of balances means an uptrend, and a falling staircase means a downtrend. Every small pullback that holds at the previous balance is a confirmation that the trend is still intact.

Step 17Section title: understanding trend from the large players' perspective
A section divider: the transition from reading a single balance area to reading a full series of them as a trend.
Step 18Diagram: a series of consecutive balances trending upward with small pullbacks that hold — an uptrend
Four consecutive balance areas, each higher than the previous, and between each area and the next a small pullback that holds at the edge of the previous area without fully breaking it. This is the definition of an uptrend from the balance-areas perspective.
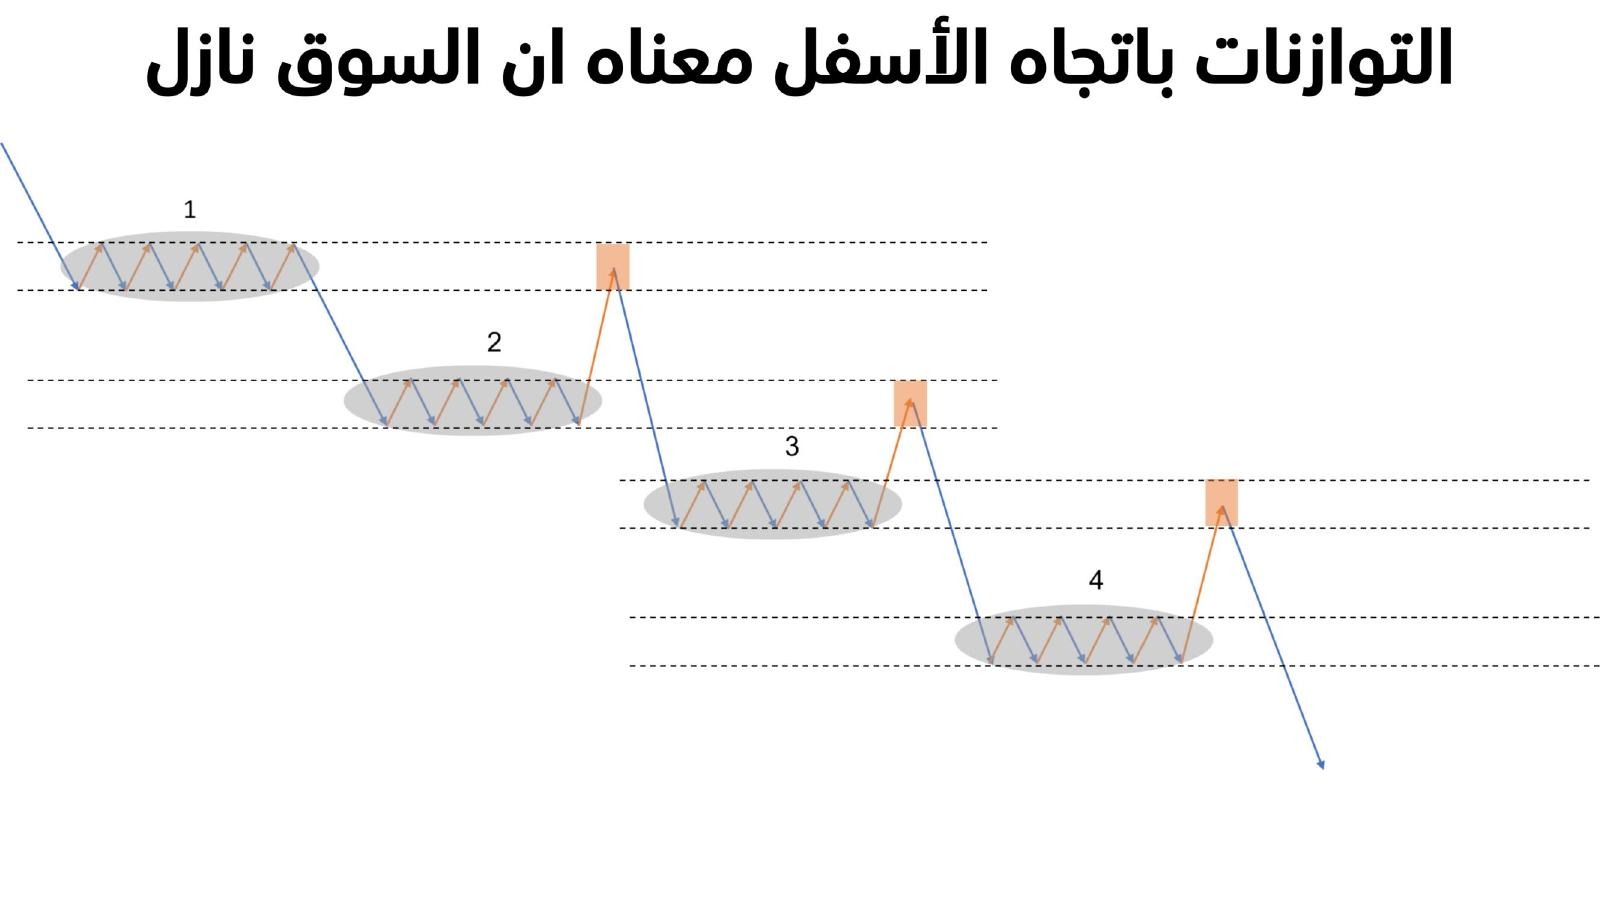
Step 19The same staircase idea inverted for a downtrend
Exactly the same idea inverted: a staircase of consecutive balance areas each lower than the previous = a downtrend.
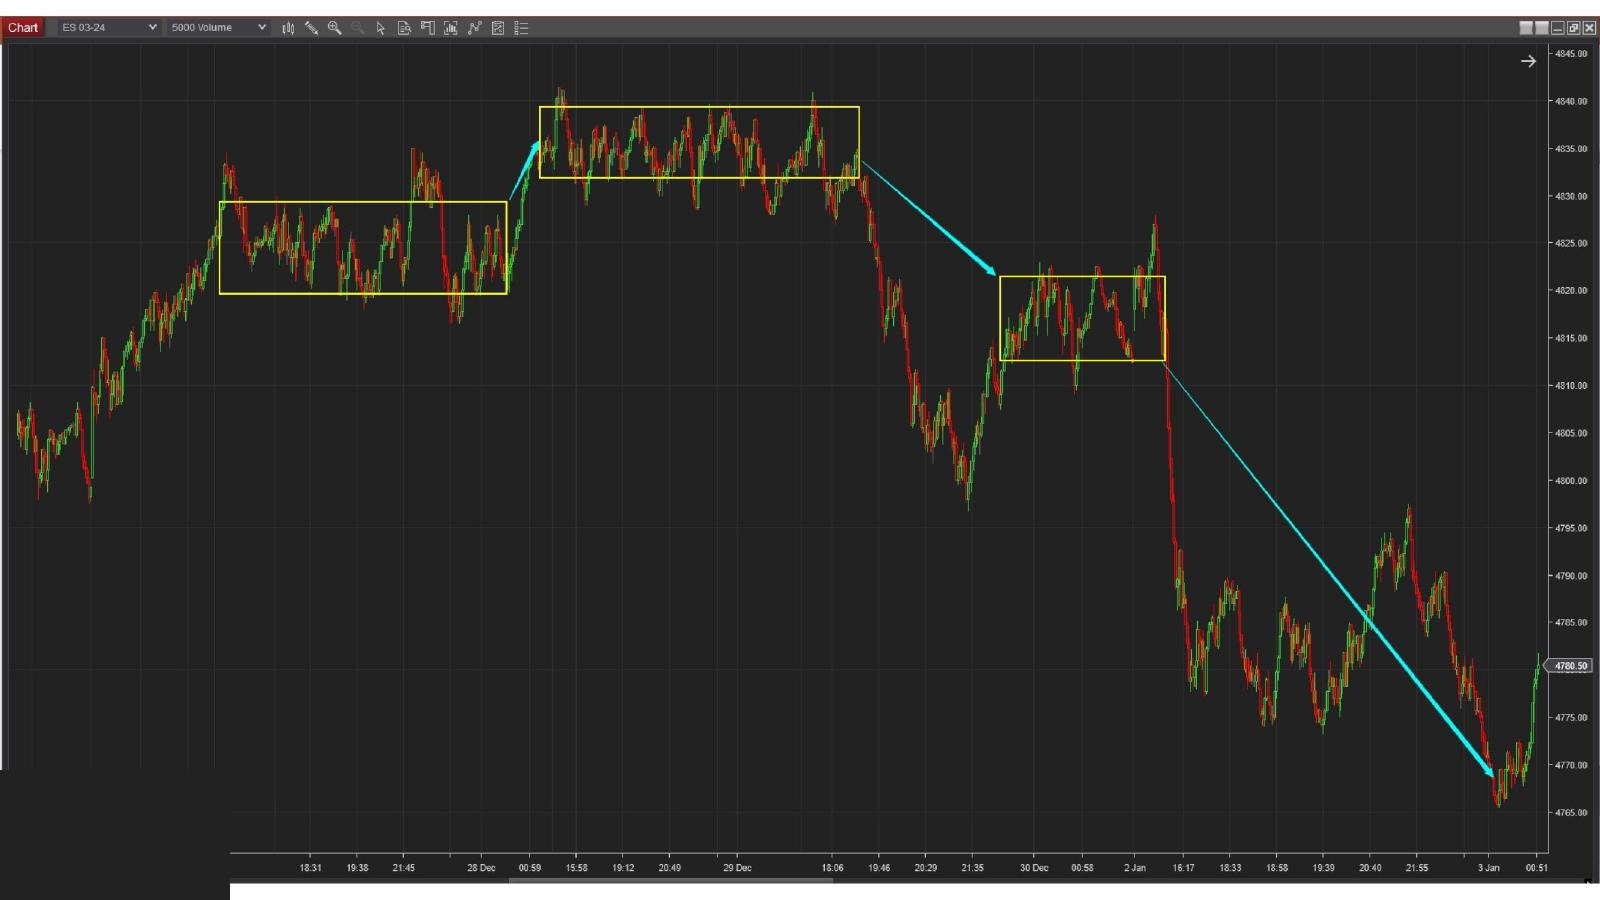
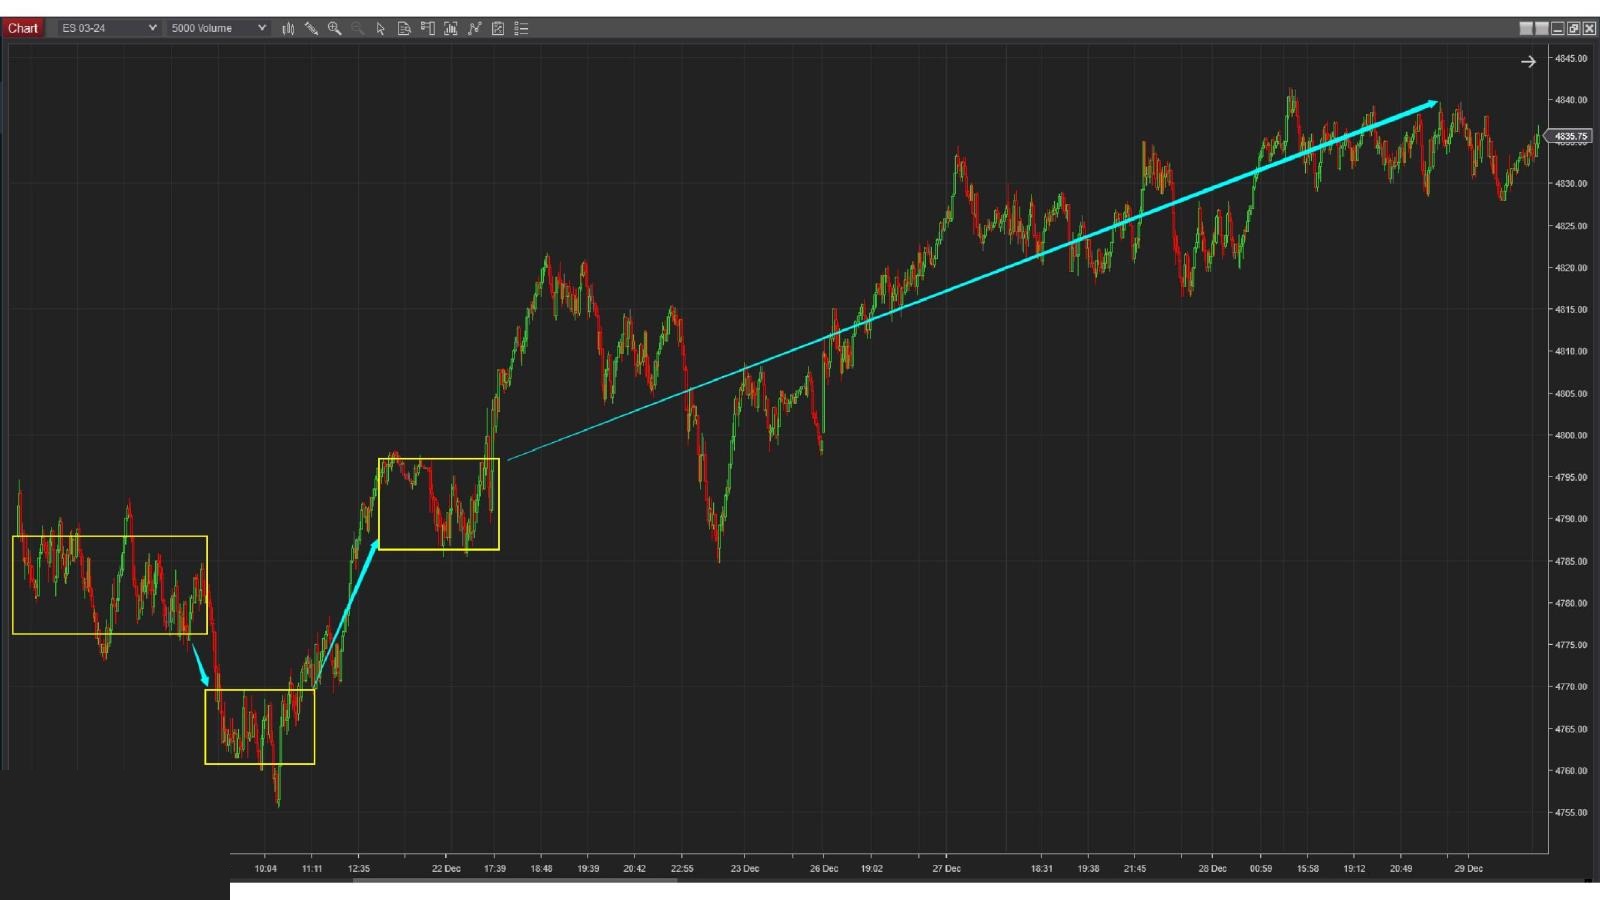
Step 21A real chart example of an actual rising staircase
A real example: two early balance boxes connected by a short arrow, followed by a small holding pullback, then continuation of the larger uptrend along a long diagonal line toward a much higher level — an actual embodiment of the staircase idea on real data.
Step 23Another real example: a short pullback between two boxes then continuation of the larger uptrend
Another example: a short downward pullback between two early balance boxes, then continuation of the larger uptrend for a long time — showing that small pullbacks within the trend do not invalidate the staircase as long as they have not fully broken the previous balance area.

The invalidation and reversal rule

The decisive rule: if price fully breaks the previous balance area and does not pull back to retest it, but instead builds a new balance area behind it rather than pulling back — this confirms a reversal of the larger trend, not just a temporary correction.
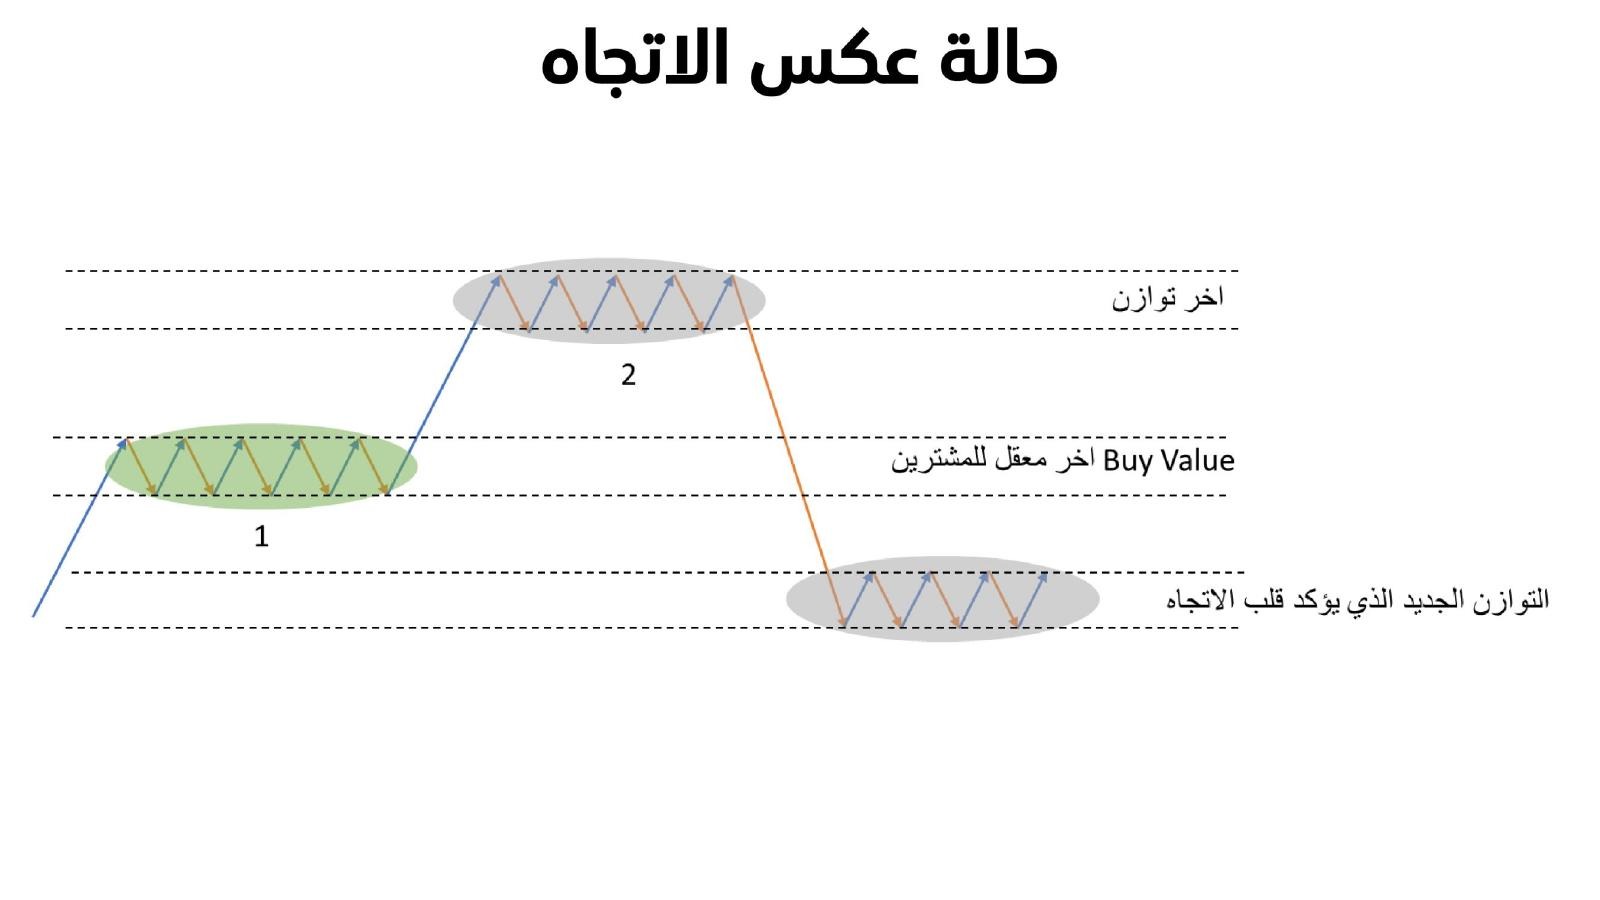
Step 20Diagram: fully breaking the last-stronghold-of-the-buyers area and building a new balance behind it confirms a trend reversal
In an uptrend that was building a natural staircase, price fully breaks the "last stronghold of the buyers" area, does not pull back to retest it, but instead builds a new balance area completely below it. This new balance is the evidence: the reversal is confirmed, not just a passing pullback.
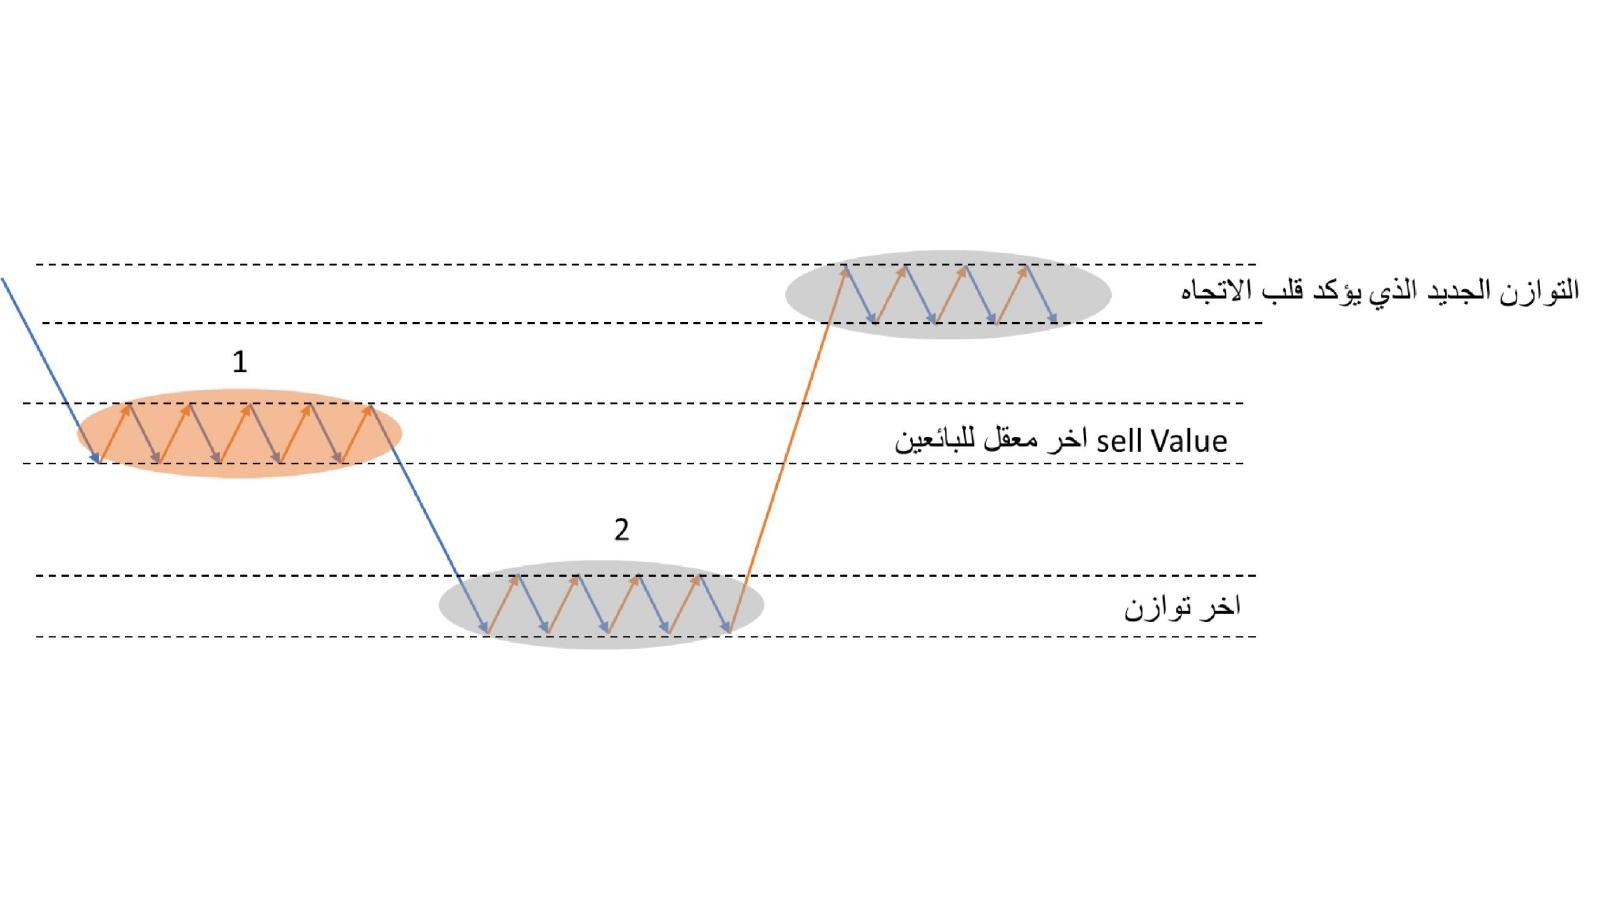
Step 22The same reversal idea inverted from a downtrend to an uptrend
The same logic inverted: fully breaking the "last stronghold of the sellers" area without a pullback, and building a new balance above it, confirms a trend reversal from down to up.
Next step
The day's gate: the first 30-minute range (IVB)
Next →

Interpretive content based on a personal reading of illustrated educational material. Not affiliated with any broker or platform, and does not constitute a trading recommendation or a performance guarantee.