
Tools
MA ICT Killzones & Pivots for NinjaTrader 8 and ATAS
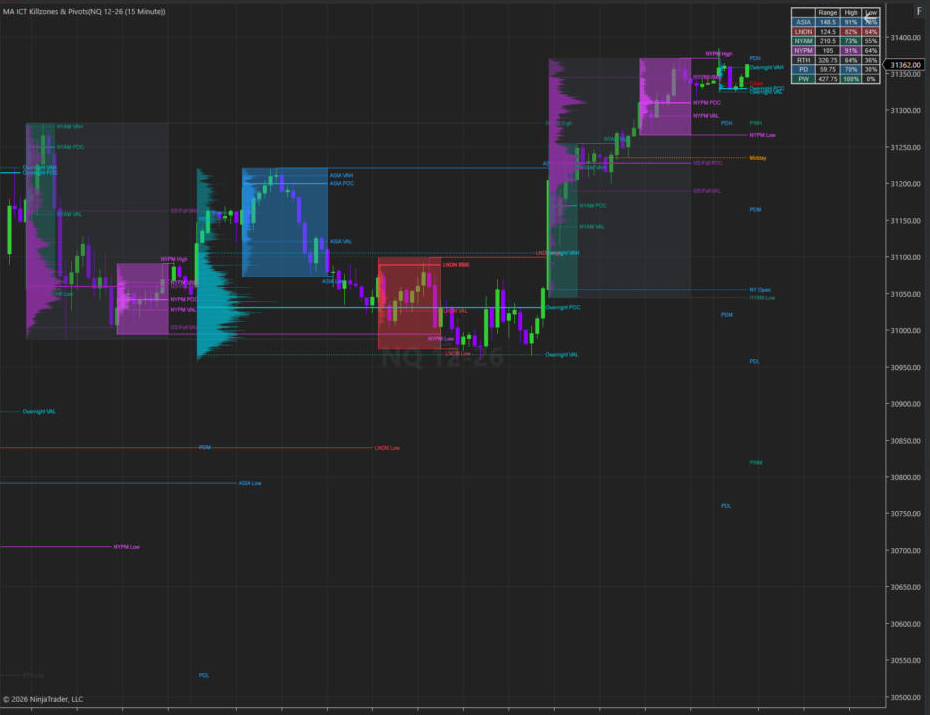
Session structure and value on one chart: killzone boxes, session high, low and midpoint, opening levels and an independent Session Volume Profile with POC, VAH and VAL for every session, including Overnight and US Full on New York time. Available for NinjaTrader 8 and ATAS.
Version 1.0.0 · Windows · NinjaTrader 8.1.8.3 (tested) or ATAS 8.0.15 or later · compiled package, no source code
What MA ICT Killzones & Pivots does
MA ICT Killzones & Pivots is an indicator for intraday futures and order-flow analysis on NinjaTrader 8 and ATAS. It divides the trading day into time-of-day sessions, the killzones, and plots the references each session leaves behind: its high, low and midpoint, projected range levels, opening prices, previous day, week and month levels, and a volume profile of the session itself.
Every reference is calculated from the session that produced it, so you can study how price behaves around a prior session's value area, its extremes and its opening levels, today and across the historical sessions loaded on the chart. Statistics show how often each type of level has been reached in the past, which turns the chart into a record of how the market treated those references.
It is an analysis tool: it does not place orders and does not generate buy or sell signals. The same calculations run on both platforms; only the source of volume-at-price data differs (see the platform comparison below).
Key features
Killzones and session boxes
Up to six configurable killzones (ASIA, LNDN, NYAM, NYL, NYPM and RTH by default) with session boxes, sessions that cross midnight and a configurable history limit.
Session high, low and midpoint
Pivot lines with labels for each session, extended until mitigated or past mitigation, with hit-rate statistics and real-time break alerts.
Session Volume Profile
An independent profile per killzone plus the Overnight and US Full sessions, with POC, VAH and VAL, adjustable Value Area %, histogram and level extension.
Opening levels and time markers
Opening-price lines (09:30, 12:00 and 16:00 by default), vertical time markers and optional day, week and month opens.
Previous day, week and month
Prior high, low and midline for each period, optional dividers and hit-rate statistics showing how often each level was reached.
Range levels and statistics
Range projections from the average, median or standard deviation of past sessions, plus an in-chart table of session ranges and hit rates across historical sessions.
Sessions on New York time
Overnight
18:00–09:29 New York
From the evening futures reopen to the minute before the cash open. Its profile shows where value formed overnight, before regular trading hours begin.
US Full
09:30–16:00 New York
The full US cash session. Its POC, VAH and VAL summarise where the regular-hours auction accepted price.
Both sessions use the America/New_York time zone with automatic daylight-saving handling, so they stay aligned with the New York clock all year, including the weeks when Europe and the US change clocks on different dates. Killzone times follow the indicator's time-zone setting, New York by default.
Session Volume Profile: POC, VAH and VAL
A volume profile shows how much volume traded at each price during a session. It turns a session into a distribution, making it easy to see where the market accepted price and where it moved through quickly.
- POC — Point of Control
- The price with the most traded volume in the session: the level the auction treated as fairest.
- VAH and VAL — Value Area High and Low
- The upper and lower edges of the value area. Price returning inside them suggests acceptance; moving away from them suggests a search for new value.
- Value Area
- The range around the POC that holds a set share of the session's volume, 70% by default and adjustable in the settings. It is built by expanding from the POC towards the side with more volume until the target share is reached.
- Volume distribution by price
- The optional histogram draws the full distribution, so high-volume nodes (prices the market accepted) and low-volume areas (prices it passed through quickly) are visible at a glance.
The profile is built only from volume the platform actually reports at each price. It never spreads a candle's volume across its range and never reconstructs bid/ask volume. If a session does not have the required data, the indicator shows Insufficient Data on the chart instead of drawing levels.
How to read the levels
The indicator gives you references; the interpretation stays with you. These are common ways traders who use Auction Market Theory read session levels:
Overnight value versus the US open
Compare where the US session opens with the Overnight value area. An open inside value often points to a balanced, two-sided start; an open outside value shows the market is already testing prices away from overnight acceptance.
Acceptance or rejection at VAH and VAL
When price trades beyond a value-area edge and builds volume there, the market is accepting new prices. A quick move back inside value suggests the move was rejected and the old value still holds.
The POC as the fairest price
The POC marks where the session did the most business. In balanced conditions price often rotates around it; in trending conditions it is left behind as the auction moves to new value.
Killzone highs and lows
A session's extremes are where the auction stopped in that time window. Whether price later breaks them, and whether the break holds, is part of the story the hit-rate statistics summarise.
Using the statistics
Hit rates show how often each level type was reached across the sessions loaded on your chart. They describe the past on your data and are not a forecast.
Settings overview
- Killzones
- On/off, name, colour and HHMM-HHMM time for each of the six sessions; box transparency and session limit.
- Pivots
- Line style and width, midpoints, labels, alerts, and how long pivots extend.
- Range data and levels
- Statistics table position and size, lookback, range measurement and the list of level multipliers.
- Day, week and month
- Opens, high/low, midlines, dividers, history depth and break alerts.
- Opening prices and timestamps
- Custom times, colours and labels, entered as a short list (for example 0930, blue, NY Open).
- Session Volume Profile
- Per-session on/off including Overnight and US Full, Value Area %, POC / VAH / VAL visibility and style, histogram and extension.
- Global
- Time zone (New York with DST or fixed GMT offsets), label size, drawing cutoff time and the timeframe limit (30 minutes by default).
NinjaTrader 8 and ATAS
The calculations are the same on both platforms; the differences come from how each platform provides data and alerts.
NinjaTrader 8
- Volume source for the profile: the 1-tick trade series (default, requires historical tick data; Tick Replay is not required), Volumetric bars (Order Flow+), or single-price bar volume
- Day, week and month levels follow the chart's Trading Hours template (an ETH template is recommended for futures)
- Alerts appear in NinjaTrader's Alerts window
- Tested with NinjaTrader 8.1.8.3
ATAS
- Volume source for the profile: ATAS cluster (volume-at-price) data
- Configurable ticks per row for the profile (1 by default)
- Day, week and month levels follow the chart's ATAS session settings
- Alerts use the ATAS alert system; tested with ATAS 8.0.15.302
Where it fits in Order Flow and Auction Market Theory
The indicator gives structure to concepts covered across this site: a session's value area frames balance, a break away from it marks imbalance and price discovery, and the reaction at VAH, VAL or the POC shows whether the market accepts or rejects a price.
- Order FlowHow aggressive and passive orders move price, and why the auction matters.
- Auction Market TheoryBalance, imbalance and the two-sided auction behind every profile.
- Volume Profile guideReading POC, value area and volume nodes in practice.
- Market auctions and session volume profileUsing session profiles to follow acceptance, rejection and value migration.
- Market structureFraming sessions within the broader market structure.
- Failed auctionsWhat it means when price is rejected at the edge of value.
Who it is for
- Futures traders who work around session structure, for example in NQ, MNQ, ES or GC
- Order-flow traders who want session value as a reference for their reads
- Volume Profile and Auction Market Theory traders
- Intraday traders who plan around the Overnight session and the US open
- NinjaTrader 8 and ATAS users who want killzones and session profiles in a single indicator
Installation
NinjaTrader 8
- 1
Download the package
Download MA-ICT-Killzones-Pivots-NinjaTrader-v1.0.0.zip. Do not unzip it.
- 2
Import it
In NinjaTrader 8 open Tools → Import → NinjaScript Add-On…, select the ZIP and confirm. Restart NinjaTrader if it asks.
- 3
Add the indicator
Open a chart, then Indicators… and add MA ICT Killzones & Pivots. For the Session Volume Profile, make sure historical tick data is available for the loaded days.
ATAS
- 1
Download and unzip
Download MA-ICT-Killzones-Pivots-ATAS-v1.0.0.zip and unzip it.
- 2
Copy the DLL
Close ATAS, then copy MAICTKillzonesPivots.dll into %APPDATA%\ATAS\Indicators (paste that path into the Windows Explorer address bar).
- 3
Add the indicator
Start ATAS, open a chart, open Indicators and add MA ICT Killzones & Pivots from the MA category. The Session Volume Profile needs cluster (volume-at-price) history for the loaded days.
Frequently asked questions
Does the indicator repaint?
Levels of completed sessions do not change. Levels of the session in progress update as it forms (its high, low, POC, VAH and VAL can move until the session ends), which is how a developing session profile works.
Does NinjaTrader 8 need Tick Replay?
No. The default profile source is a 1-tick trade series, which needs historical tick data from your data provider but not Tick Replay. On a Volumetric chart (Order Flow+) the Volumetric data can be used instead.
Why does a session show Insufficient Data?
The chart does not have volume-at-price data for that session, for example because tick or cluster history was not loaded for those days. The indicator shows this message instead of estimating levels.
Which instruments and timeframes does it work on?
It works on any instrument the platform charts. Drawings appear on charts whose bar period is up to the Timeframe Limit setting (30 minutes by default), which keeps intraday session levels readable.
Video resources
Third-party videos (in English) that explain the concepts behind the indicator. They are external content on YouTube and are not affiliated with this site.
- ICT Killzones & Indicator SettingsTTradesWatch on YouTube ↗
- Volume Profile 101 — POC, VAH & VAL ExplainedMikraahWatch on YouTube ↗
- Understanding Auction Imbalances In Trading — Market & Volume ProfilingAxia FuturesWatch on YouTube ↗
- Auction Market Theory Explained in 20 MinutesTrader DrysdaleWatch on YouTube ↗
Download MA ICT Killzones & Pivots — v1.0.0
- Version
- 1.0.0
- NinjaTrader 8
- MA-ICT-Killzones-Pivots-NinjaTrader-v1.0.0.zip
- ATAS
- MA-ICT-Killzones-Pivots-ATAS-v1.0.0.zip
A comprehensive guide to Volume Profile in futures trading: understanding Volume by Price, Point of Control (POC), Value Area (VAH/VAL), and HVN/LVN liquidity nodes.
Gold futures (GC) spent July 13–14 in a wide, high-volume balance roughly between 3993 and 4099, with a point of control near 4067. That balance broke down hard into July 16–17, p…
Tools I build and use for research, execution, and learning.
Disclaimer
- This indicator is a market-analysis tool only. It is not financial advice and does not guarantee any trading result.
- MA ICT Killzones & Pivots is proprietary software, distributed as compiled, protected assemblies. Copyright © 2026 Mohamed Abdelaziz. All rights reserved. One included component is licensed under the Mozilla Public License 2.0; see the notices on GitHub.
- Trading futures involves substantial risk of loss. Past performance does not guarantee future results.