
The Uncomfortable Truth About Failed Trades
Every trading strategy produces losing trades. This is not a weakness — it's arithmetic. No approach identifies high-probability setups with 100% accuracy, and anyone who claims otherwise is selling something. The question is not how to avoid losses, but how to respond to them intelligently.
Most traders respond to a failed setup by closing the position, accepting the loss, and walking away from that market for a while. This is reasonable. But there is a more sophisticated response — one that turns a clear, decisive failure into its own form of information, and sometimes its own trade opportunity.
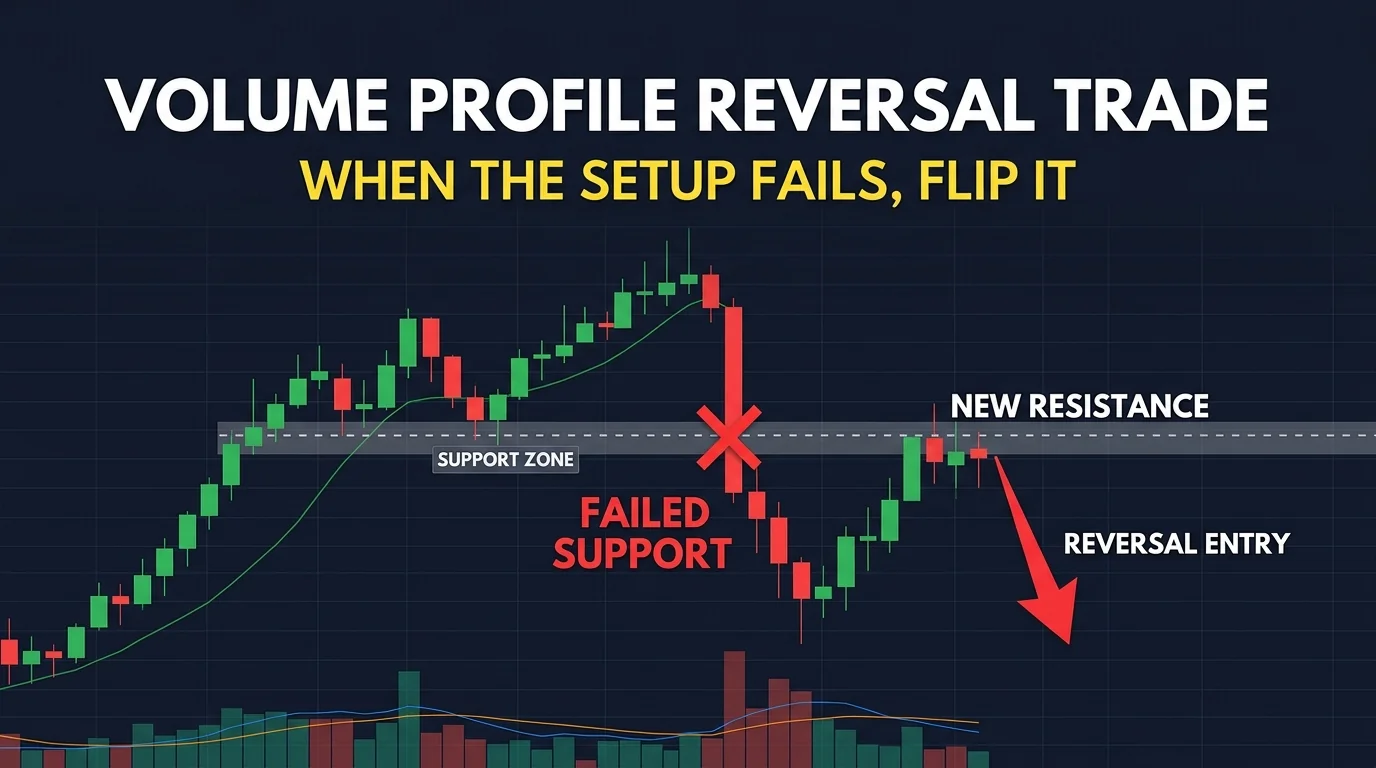
The Volume Profile reversal trade is built on a simple insight: when a key support or resistance level fails with conviction — when price doesn't just wiggle through it but breaks decisively — that failure is not random noise. It is a market statement. The level that everyone thought would hold didn't. The participants defending it were overwhelmed. And the price level that used to be support or resistance often takes on the opposite function going forward.
What Is a Volume Profile Reversal Trade?
The Volume Profile reversal trade is a setup that activates when a significant support or resistance level breaks convincingly. Instead of simply accepting the loss and moving on, you reassess the broken level as a potential entry point in the opposite direction.
The concept rests on a well-documented market behavior: broken support becomes resistance, and broken resistance becomes support. When price decisively breaks through a level that previously held, that level changes function. Former buyers who were protecting support are now trapped with losses and looking to exit on any rally back to the level. Former sellers at resistance who were short are now profitable and may look to add on any rally back to their entry zone.
The sum of these dynamics means that when price returns to a freshly broken level, it tends to find the opposite type of pressure that previously existed there. This flip in the level's character is the entry opportunity the reversal trade exploits.
The Psychology Shift: From Failure to Opportunity
The hardest part of the reversal trade is not the mechanics — it's the mindset. When you've been watching a support level, perhaps even entered a long from it, and then see that level break decisively downward, your natural reaction is disappointment and frustration. The setup failed.
The reversal trade requires you to immediately reframe that experience:
- The support level's failure is not bad luck — it is information
- The break confirms that sellers are dominant at this stage
- The level that you were defending as a buyer is now a place where sellers have demonstrated control
- Price returning to that level is your opportunity to enter with the sellers, not against them
This mental shift — from "my trade failed" to "the market just told me which direction is dominant and where to enter from" — is the defining characteristic of traders who use the reversal trade effectively. It requires genuine emotional detachment from the previous trade's outcome.
Three Conditions for a Valid Reversal Trade
Not every broken level is a valid reversal trade opportunity. Three conditions distinguish a genuine reversal setup from a random break:
Condition 1: The Original Level Must Have Been Significant
Reversal trades only carry weight when the level that broke was genuinely meaningful — a level with a clean prior history of holding, supported by Volume Profile data (a high-volume node, point of control, or value area edge), or aligned with other structural references (vwap-pullback">anchored VWAP, prior swing extreme).
A level that broke on its first test, or a level you drew arbitrarily, doesn't qualify. The significance of the original level is what gives the reversal entry its structural basis.
Condition 2: The Break Must Be Decisive
The break needs to be clear and convincing — not a brief wick below support that immediately reversed, but a candle (or candles) that closed meaningfully through the level. The more decisive the break, the clearer the statement the market is making about the level's new direction.
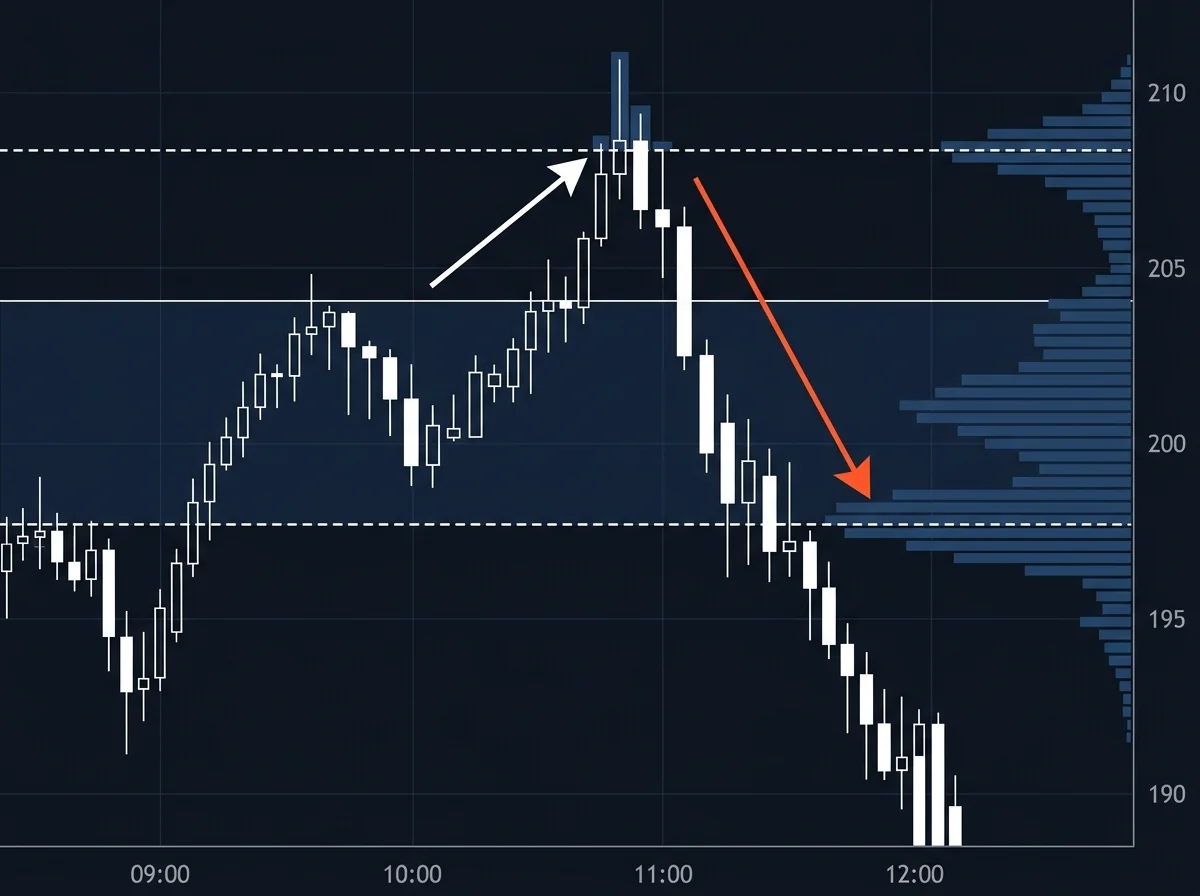
Signs of a decisive break:
- A large candle body (not mostly wick) closing beyond the level
- Increased volume on the breaking candle compared to surrounding candles
- Momentum continuation for at least 1-2 candles after the break, confirming the level was genuinely violated
Condition 3: Price Must Return to the Broken Level
The reversal entry doesn't trigger at the point of the break — it triggers when price returns to the broken level after moving away. This pullback is essential. Without it, you're chasing a momentum move at an unfavorable price. With it, you're entering precisely at the point of maximum structural evidence — the level that recently confirmed its directional bias.
Failed Support: Setting Up a Short Reversal
The most common application of the reversal trade is a failed support level converting to resistance.
The sequence:
- Price is approaching a significant support zone you've identified (Volume Profile node, prior swing low, etc.)
- You may have already entered a long from this support — or you've been watching it as a potential entry
- Price reaches the support and breaks through it decisively — a large bearish candle closes significantly below the level
- Price continues downward for several candles, validating the break
- Price then begins to pull back upward, retracing toward the broken support level
- As price re-enters the zone of broken support, you enter short — anticipating that what was support now acts as resistance
Stop loss placement: Above the zone of the broken level plus a small buffer. If price pushes convincingly above the former support, the reversal thesis is wrong and you exit.
Target placement: The next significant support zone below — a Volume Profile level of interest, a prior swing low, or a major structure level visible on higher time frames.
Failed Resistance: Setting Up a Long Reversal
The mirror image: when resistance breaks decisively upward, that resistance level often becomes support.
The sequence:
- Price approaches significant resistance (Volume Profile concentration zone, prior swing high)
- Price breaks through decisively — a large bullish candle closes significantly above the resistance level
- Price continues upward for several candles
- Price pulls back downward, returning toward the broken resistance level
- As price re-enters the zone of the former resistance, you enter long — anticipating that what was resistance now acts as support
Stop loss: Below the broken resistance zone with a buffer. A break back below the level invalidates the reversal.
Target: The next significant resistance above — a Volume Profile node, prior swing high, or major structural level.
| Original Level | Break Direction | New Function | Reversal Trade |
|---|---|---|---|
| Support | Downward (bearish break) | Becomes resistance | Short on pullback to the zone |
| Resistance | Upward (bullish break) | Becomes support | Long on pullback to the zone |
Entry, Stop Loss, and Target for Reversal Trades
The precise mechanics of the reversal trade entry deserve careful attention because the entry price significantly affects the risk-reward ratio:
Entry: Enter as price returns to the former level and shows the first sign of rejection. Don't enter the moment price touches the zone — wait for a candle or two of confirmation that the level is indeed behaving as anticipated in its new function. This might be a bearish candle forming at the former support (now resistance) for a short, or a bullish candle forming at former resistance (now support) for a long.
Stop loss: Place the stop on the other side of the zone, with a buffer sized for the volatility of the instrument. A tight stop very close to the zone's edge risks being stopped by normal price fluctuation. A stop too wide removes the risk-reward advantage. As a general guideline, the buffer should be 25-50% of the zone's width.
Take profit target: Look for the next meaningful structural level in the direction of your reversal trade. For a short reversal from broken support, this is the next Volume Profile level or prior swing low below the break zone. The risk-to-reward ratio should be at least 2:1 for the setup to be worthwhile.
The Broken Level's New Role: Why It Works
The mechanics behind the support-to-resistance and resistance-to-support flip are rooted in the behavior of the traders who were positioned at the level.
Former support buyers: Traders who entered long at support now have losing positions after the break. Their stop losses are typically placed below the support, meaning they've already been stopped out. However, many traders enter without stop losses, or set stops too tight. These participants are holding losing longs and looking for an opportunity to exit without further loss. When price rallies back to their entry (the former support level), they close their positions — adding selling pressure precisely at the zone that used to be support.
New sellers: Traders who shorted the breakout (or who identified the break as a trend change signal) have profitable short positions and are watching the same former support zone as a logical area to add to their position if price revisits it.
The combination of trapped buyers exiting and new sellers entering creates concentrated selling pressure at the level — which is why former support so reliably becomes resistance.
The same dynamic applies in reverse at former resistance levels.
Reversal Trade vs. Fakeout: How to Tell the Difference
A critical question: how do you distinguish a genuine level break (which sets up a reversal trade) from a fakeout (where price temporarily breaks the level and then reverses back)?
The distinctions are not always clear in real time, but several factors increase the probability that a break is genuine:
Candle character: A genuine break shows a large body candle — one where most of the price movement is captured in the body, not just a wick. A wick below support that recovers immediately within the same candle suggests a fakeout. A full candle body closing well below support suggests genuine commitment.
Volume: A high-volume break is more likely to be genuine. Low-volume breaks of key levels are suspect and often reverse quickly.
Follow-through: After the break, does price continue moving in the breakout direction for 2-3 candles? Or does it immediately reverse back inside the zone? Genuine breaks sustain their direction. Fakeouts reverse quickly.
Context: Is the break happening at the end of a prolonged trend, near a major structure extreme? Exhaustion breaks near major levels are more likely to be fakeouts. Breaks occurring within a developing trend context are more likely to be genuine continuation.
When a break shows all the characteristics of a fakeout — small candle body, low volume, immediate reversal — don't look for a reversal trade in the breakout direction. Instead, look for a continuation trade back in the original direction if conditions support it.
Common Mistakes to Avoid
Taking reversal trades from every broken level. Only significant levels with clear Volume Profile backing, prior structural history, and decisive break characteristics qualify. Random or minor levels that break produce low-quality reversal setups.
Entering at the point of the break rather than the pullback. The reversal trade entry requires the pullback. Entering immediately after the break at a momentum-driven price reduces your risk-reward and removes the structural precision that makes the setup work.
Setting a stop too close to the zone. The zone itself has some width — it's not a single price line. Your stop needs to account for this width plus normal price fluctuation, or you'll be stopped by noise at a level that is actually acting as expected.
Confusing reversal trades with averaging into a losing position. If you had a long trade that hit its stop loss when support broke, the reversal trade is a completely separate, new trade in the opposite direction. It is not adding to your losing long. These are distinct and must be treated as such, with fresh risk management applied.
Missing the entry because you're still emotionally attached to the failed direction. After a long trade is stopped out by a support break, the reversal trade requires you to actively short the same level that hurt you. This counterintuitive action is psychologically difficult but mechanically correct when the conditions are valid.
Final Thoughts
The Volume Profile reversal trade transforms a losing scenario into a learning framework. When a key level breaks with conviction, you don't just absorb the loss and wait for the next setup — you reassess the broken level, recognize its new function, and position yourself to benefit from that structural shift.
This approach demands two things that separate disciplined traders from reactive ones: the analytical clarity to recognize that a decisive break is meaningful information, and the emotional detachment to trade in the opposite direction from a recently failed position.
Volume Profile underpins the setup by confirming which levels carry genuine structural weight. Only levels with a clear volume basis deserve to be treated as potential reversal zones. When the Volume Profile says the level matters, and price has just declared the opposite of what you expected, the reversal trade is your response — a structured, evidence-based pivot that transforms market failure into market information.
FAQ
What is the Volume Profile reversal trade?
A setup triggered when a significant support or resistance level breaks decisively. The broken level is expected to reverse roles — former support becomes resistance, former resistance becomes support — providing an entry opportunity in the opposite direction on the pullback.
How is this different from simply reversing a losing trade?
The reversal trade is a new, independent position entered after the original trade has been closed (at its stop loss). It requires specific conditions — a significant level, a decisive break, and a pullback to the broken zone — rather than emotionally reacting to a loss by flipping the direction.
What does a "decisive break" look like?
A large candle body (not just a wick) closing meaningfully through the level, with above-average volume on the breaking candle, followed by continuation in the breakout direction for at least 2-3 candles without immediately reversing back inside the level.
How do I set the stop loss for a reversal trade?
Place the stop on the opposite side of the formerly broken level, with a buffer accounting for the zone's width and normal price fluctuation. For a short reversal from broken support, the stop goes above the former support zone.
What is the target for a reversal trade?
The next significant structural level in the direction of the reversal — typically the next Volume Profile node, prior swing high/low, or major support/resistance level visible on higher time frames.
Does this work without Volume Profile?
The reversal concept itself works on any significant S/R level. Volume Profile adds precision by confirming which levels carry institutional weight. Using purely price-based S/R without Volume Profile context is possible but produces more ambiguous setups.
Disclaimer: Educational content for traders. Not financial advice, not a signal service, and no outcome is guaranteed. Test every rule yourself before risking capital.
Comments (0)
Comments are moderated. Your comment will appear after it's approved.
Comments are moderated. Your comment will appear after it's approved.
Loading comments…