
What Is an Auction in Market Structure?
Every price chart you have ever looked at represents an ongoing auction. Buyers and sellers continuously negotiate prices — sellers offer higher, buyers bid lower, and the market moves toward wherever both sides can temporarily agree. Every candle high and candle low marks a point where one side of that negotiation ran out of counterparties and price reversed.
When an auction completes properly, it finishes cleanly. The market reaches a high or a low, fully exhausts the participants at that extreme, and then reverses with clear evidence that the level was genuinely tested. On a footprint chart, this clean completion leaves a very specific signature — and it is the absence of that signature that defines the concept at the heart of this article.
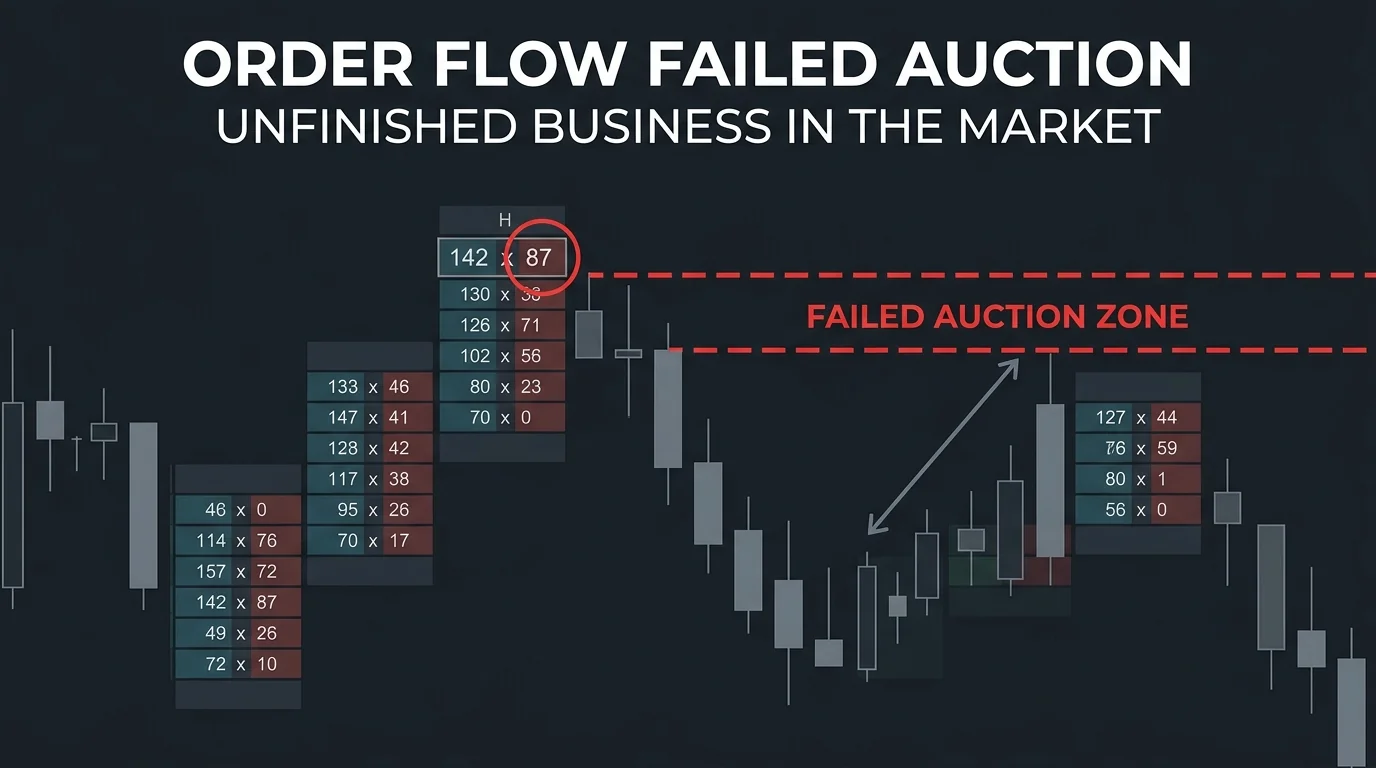
An order flow failed auction is simply an auction that did not complete properly. The market reached an extreme, turned around, and left behind a structural imperfection — a gap in the footprint's data that experienced Order Flow readers learn to recognize immediately. That imperfection has a powerful implication: markets have a strong tendency to return to unfinished levels and close them out.
What Makes an Auction "Failed"?
Before answering this, it helps to understand what a completed auction looks like in footprint terms.
Every row in a footprint candle shows two numbers separated by an × symbol. The left number represents volume traded on the bid side (sellers hitting the market). The right number represents volume traded on the ask side (buyers lifting the offer). Together, these numbers tell you exactly who was active at each price level during that candle period.
At a properly completed candle high, the top row of the footprint should show:
- A non-zero number on the right (ask side) — buyers were active at this high price
- A zero on the left (bid side) — no sellers pushed through above this level
At a properly completed candle low, the bottom row should show:
- A non-zero number on the left (bid side) — sellers were active at this low price
- A zero on the right (ask side) — no buyers pulled price below this level
These zeros are critical. They confirm the market fully exhausted one side of the auction at the extreme, creating a genuine turning point.
The Zero Rule: How to Spot It on a Footprint Chart
The rule for identifying an order flow failed auction can be stated simply:
If the zero is missing where it should be, the auction failed.
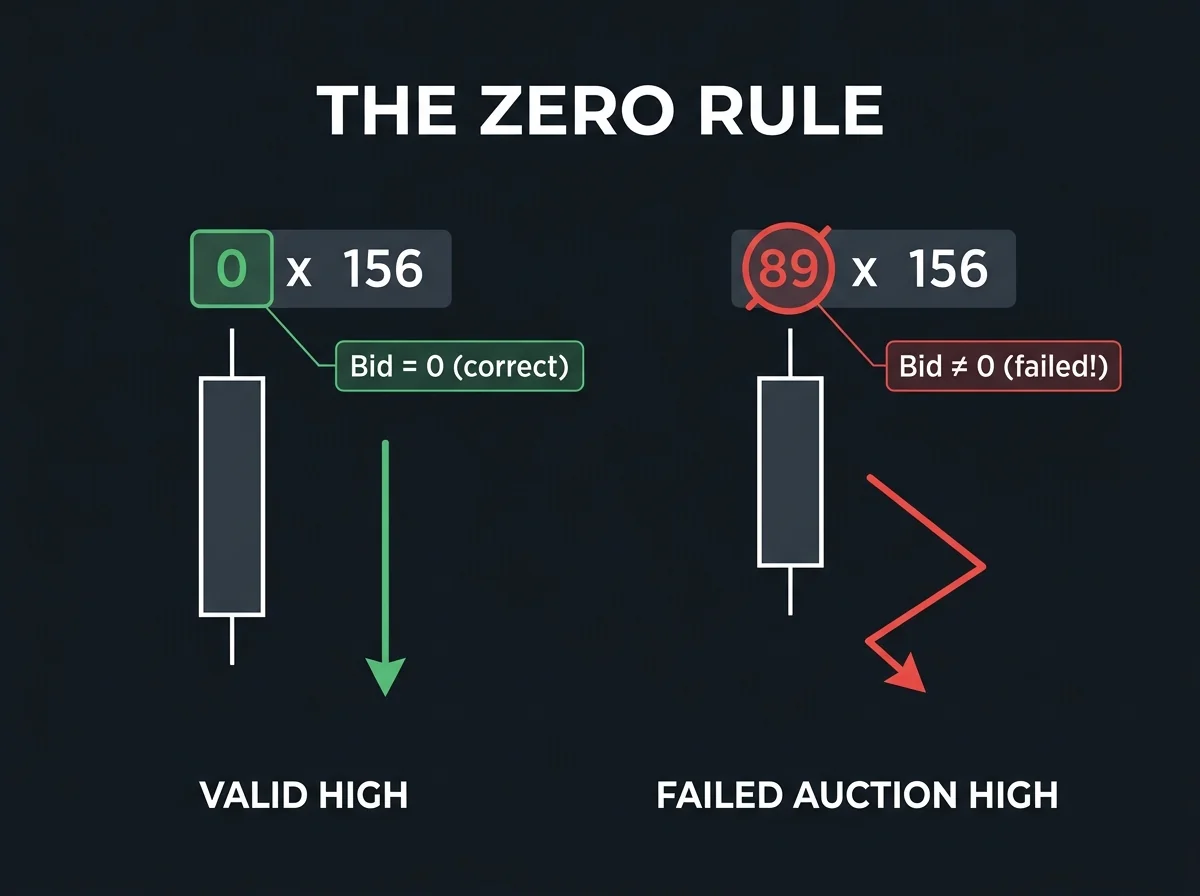
At a failed candle high:
- The top row shows a non-zero number on BOTH sides (e.g., 89 × 156)
- The bid side (89) should have been zero — the market never exhausted sellers at this high
- The implication: the market tried to move higher, found some selling, but didn't complete the process cleanly
At a failed candle low:
- The bottom row shows a non-zero number on BOTH sides (e.g., 134 × 47)
- The ask side (47) should have been zero — the market never exhausted buyers at this low
- The implication: the market tried to push lower, found some buying, but turned back before the auction was complete
These are the "missing zeros" that define every failed auction. Once you train your eye to check specifically for this pattern at the high and low of each footprint candle, you will begin spotting them routinely — often in less than a second per candle.
Valid vs. Failed: A Side-by-Side Comparison
Understanding the contrast makes the pattern much clearer:
| Location | Valid Auction | Failed Auction |
|---|---|---|
| Candle High | 0 × 245 at the top row | 89 × 245 at the top row |
| Candle Low | 312 × 0 at the bottom row | 312 × 67 at the bottom row |
| Market Meaning | Fully exhausted — clean reversal | Left incomplete — unfinished business |
| Price Implication | Reversal at this level is confirmed | Market likely to return and retest |
Notice in the valid examples how one side is always zero. The auction ran all the way to the extreme, used up all available counterparties on one side, and then reversed. The failed examples show both sides active at the extreme — meaning the market turned around mid-auction without completing it.
Why the Market Returns to Failed Auction Levels
The mechanics of why markets return to failed auction levels are rooted in how market participants process structural information.
When price turns around at a failed auction, it leaves behind an open question in the market's structure. Participants who track this data — primarily institutional traders and professional Order Flow readers — know that the price level was not genuinely tested to exhaustion. The auction remains incomplete.
This creates what is sometimes described as a magnet effect: a tendency for price to gravitate back toward the failed auction level when it comes back into proximity. The market, in a sense, wants to finish what it started. Once price returns and trades through the failed auction zone — this time completing the auction properly with the correct zero in place — the level closes and no longer exerts the same pull.
The practical implication for traders is not that every failed auction will immediately pull price back to retest it. Timing is variable. A failed auction might get retested in the same session, the next day, or several sessions later. The implication is directional bias: when price begins approaching a failed auction from the opposite side, the odds favor continuation through that level rather than reversal in front of it.
This makes failed auctions useful in two distinct ways: as target levels for trades heading in their direction, and as context markers that tell you which price levels have less structural support than they might appear to have on a standard candlestick chart.
Failed Auction Clusters: When One Becomes Many
A single failed auction is a useful data point. A cluster of failed auctions grouped within a narrow price range is significantly more powerful.
Clusters form when multiple consecutive footprint candles all fail to complete their auction at the same or adjacent price levels. Instead of one missing zero at one extreme, you have three or four candles in a row each leaving the same type of imperfection — a dense band of unfinished business stacked on top of each other.
Why clusters are stronger than single failed auctions:
- Broader target zone — Multiple failed auctions create a wider price zone for price to trade through, making it more likely that any retracement will encounter and trigger the cluster
- Increased magnetic pull — The more unfinished levels stacked in one area, the stronger the tendency for price to complete them all once it enters the zone
- Rarer formation — A dense cluster of four or five failed auctions in a tight range is less common than a single one, which itself suggests a more unusual structural imbalance
- Momentum potential — When price finally enters a cluster zone, it often moves through the entire range rapidly rather than stopping at individual levels one by one
Practical use: When you identify a cluster of failed auctions on your chart, treat the entire zone — from the first failed auction to the last — as a single target area. If you have a trade heading in that direction, the cluster is your target zone. If price is approaching from the other side, expect the cluster to be tested and traded through rather than providing support or resistance.
Using Failed Auctions for Trade Management
Beyond serving as trade targets, failed auctions are a valuable trade management tool — specifically for deciding when to stay in a trade that's already moving in your direction.
Consider this scenario: You're short from a well-defined resistance level and price has been dropping in your favor for several candles. The natural question is whether to take profit now or hold for more. Failed auctions below your current price provide a compelling answer.
If you can see a cluster of failed auctions sitting below the current price level, that cluster is working as a price magnet for your trade. The market has structural motivation to trade through that zone. Rather than closing your position early out of nervousness, you have chart-based evidence for holding through to that cluster — or slightly beyond it.
Specific management rule: When managing a trade toward a failed auction cluster, target your take profit approximately one pip or tick beyond the last failed auction in the group. This accounts for the fact that the market needs to actually trade through each failed auction (completing the auction properly) before the magnetic pull is satisfied.
This approach converts failed auction analysis from a standalone pattern into an integrated part of your trade management process. You're not guessing where to exit — you're identifying where the market has structural motivation to go and exiting there.
Automating the Detection
Identifying failed auctions by eye is a learnable skill, but it requires active attention to each candle's high and low row. Some Order Flow platforms include automated detection tools that scan each footprint and mark failed auctions with a horizontal line or indicator automatically.
If your platform includes this feature, use it. Automation reduces the cognitive load of scanning every candle manually and ensures that fast-forming failed auctions during volatile sessions don't get missed. The automated marker typically extends a horizontal line from the failed auction level across future candles, making the level visible even as subsequent price action develops.
If your platform doesn't offer automatic detection, the manual process — checking the top and bottom row of each completed footprint candle for the presence or absence of the appropriate zero — takes only a moment per candle once you're practiced. Build it into your session review routine.
Common Mistakes to Avoid
Calling every irregular footprint extreme a failed auction. The pattern has a specific definition: the zero must be missing where it should be. Not every odd-looking candle extreme is a failed auction. Check the actual numbers before drawing any lines.
Treating failed auctions as immediate trade signals. The pattern predicts where price is likely to go, not when. A failed auction can sit on a chart for several sessions before price returns to test it. Patience and a well-planned entry strategy are required.
Ignoring single failed auctions in favor of clusters only. While clusters are stronger, single failed auctions still hold meaningful predictive value, particularly when they align with other structural levels — prior support or resistance, VWAP, or volume profile levels.
Applying the pattern in illiquid markets. In low-volume markets or outside peak trading hours, footprint numbers become unreliable. The data noise can create apparent failed auctions that are artifacts of thin liquidity rather than genuine structural imbalances. Use the pattern primarily in liquid markets during active sessions.
Only tracking failed auctions in one direction. Both highs and lows can fail. In any given session, you might have failed auctions above and below current price simultaneously. Track both sides — your next trade might target one in either direction.
Forgetting to clear completed failed auctions. Once price has traded through a failed auction zone and completed the auction properly, that level is resolved. Remove it from your chart so you're not drawn back to a level that no longer carries structural significance.
Final Thoughts
The order flow failed auction is one of the most structurally sound patterns available in footprint chart analysis. Unlike indicators that calculate from price data after the fact, the failed auction is visible directly in the raw volume data — it is not a derivative, not an interpretation, but a literal structural imperfection in the market's auction process.
Its power lies in the market's natural tendency to return to unfinished business. Markets are built on the principle of fair pricing through complete auctions. When an auction fails to complete, the market hasn't done its job — and it will often try again later.
For traders, this translates into a clear, repeatable framework:
- Mark every failed auction you can identify
- Pay special attention to clusters of three or more in a narrow price range
- Use clusters as target zones for trades moving in their direction
- Use single failed auctions as context — levels where the market has motivation to trade through rather than reverse at
Practice is essential. Study historical footprint charts with this lens. Mark failed auctions, observe when price returns to test them, and notice how the magnet effect plays out across different markets and time frames. Over weeks of deliberate practice, the pattern becomes as intuitive as reading support and resistance on a standard chart — and considerably more informative.
FAQ
What is an order flow failed auction?
A failed auction occurs when the high or low of a footprint candle does not have the expected zero on one side of the bid/ask pair. It indicates the market turned around without fully completing the auction process, leaving unfinished business that price tends to return to.
How do I identify a failed auction on a footprint chart?
Check the top row (high) and bottom row (low) of each footprint candle. At a valid high, the bid side should be zero. At a valid low, the ask side should be zero. If the zero is missing, it's a failed auction.
Are failed auction clusters more reliable than single failed auctions?
Generally yes. Multiple failed auctions in the same price zone create stronger magnetic pull and a wider target area, making it more likely that price will trade through the entire zone once it enters it.
Can failed auctions be used for take profit targeting?
Yes. A cluster of failed auctions below your short entry or above your long entry serves as a logical target zone. Set your take profit approximately one tick beyond the last failed auction in the cluster.
Does this pattern work in forex?
It works best in markets with precise bid/ask data, such as futures. In forex, tick volume data is used as a proxy, which reduces precision. Failed auctions can still be identified and traded in forex, but with somewhat less reliability.
How long do failed auctions stay relevant?
Until price trades through them and completes the auction properly. A failed auction that formed three sessions ago is still relevant if price hasn't returned to close it. Once price trades through and forms the correct zero in that zone, the level is resolved.
Disclaimer: Educational content for traders. Not financial advice, not a signal service, and no outcome is guaranteed. Test every rule yourself before risking capital.
Comments (0)
Comments are moderated. Your comment will appear after it's approved.
Comments are moderated. Your comment will appear after it's approved.
Loading comments…